SigmaXL Features
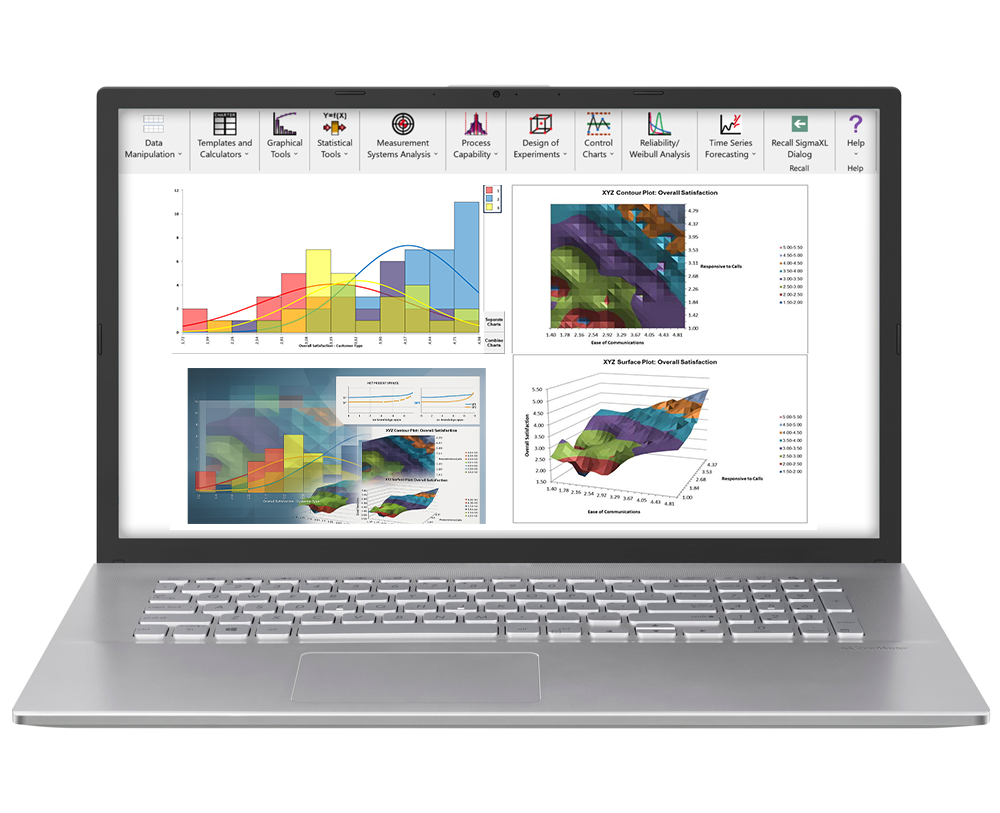
SigmaXL Version 11 includes over 200 statistical and graphical tools inside Microsoft Excel, covering Design of Experiments (DOE), Statistical Process Control (SPC), Measurement System Analysis (MSA), Gage R&R, process capability, regression, General Linear Model (GLM), logistic regression, hypothesis testing, nonparametric tests, reliability analysis, time series forecasting, and Multiple Response Optimization. New in Version 11: Definitive Screening Designs, Optimal Designs (D-Optimal, I-Optimal, A-Optimal), General Full Factorial Designs, Fraction of Design Space (FDS) Plots, Overlay Histograms, and Interaction Plots.
- Home /
- SigmaXL Features