How Do I Create Pareto Charts in Excel Using SigmaXL?
Stratification with Pareto
SigmaXL's Pareto tool allows you to create Basic (Single) or Advanced (Multiple) Pareto
Charts. Advanced Pareto charts are particularly useful in the Analyze Phase because of the
ease with which you can slice and dice (or stratify) your data. Of course, Pareto charts are
not limited to the Analyze Phase, they can also be used to aid project selection and to
prioritize in the Measure Phase.
Consider the following guidelines to help ensure that your Pareto analysis is successful:
Your Pareto analysis will only be as good as the quality of the data collected. Ensure
that you have the right data and that the data is correct. Use other graphs such as run
charts to apply a sanity check to your data.
Check process stability using appropriate control charts. If the process is not in
control, your prioritization of defects and root causes could be invalid.
Avoid collecting data over too short a time period. Your data may not be representative
of the process as a whole. Also keep in mind that since the data is discrete, a minimum
sample size of 500 is recommended with 1000 preferred.
Conversely, data gathered over too long a time period may include process changes that
could lead to incorrect conclusions. SigmaXL provides a date subsetting feature that
allows you to easily explore different time periods.
If your initial Pareto analysis does not yield useful results, explore other categories
that may be important. SigmaXL's Advanced Charts makes it easy for you to 'slice and
dice' your data with different X categories.
Consider Pareto charting measures such as cost and severity, in addition to defect
counts. SigmaXL enables you to chart multiple Y responses.
Basic (Single) Pareto Charts
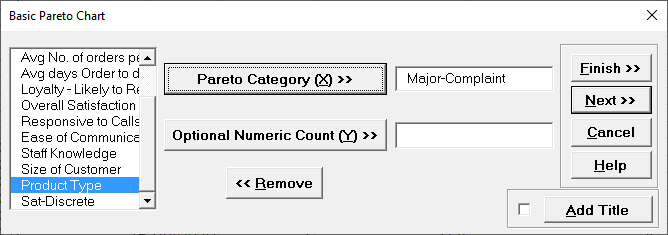
Open the file Customer Data.xlsx. Click SigmaXL > Graphical Tools > Basic Pareto Chart.
Ensure that entire data table is selected. If not, check Use Entire Data Table. Click Next.
Select Major Complaint, click Pareto Category (X) >>.
Tip: SigmaXL will automatically count the number of unique items in the
Pareto Category. If we had a separate column with a count (or cost), this count column would
be selected as the Optional Numeric Count (Y).
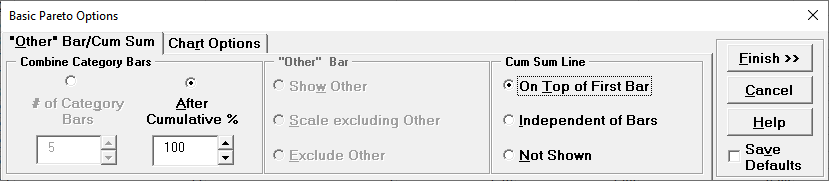
Click Next. Set Basic Chart Options as follows:
Tab "Other" Bar/Cum Sum:
Cum Sum Line On Top of First Bar
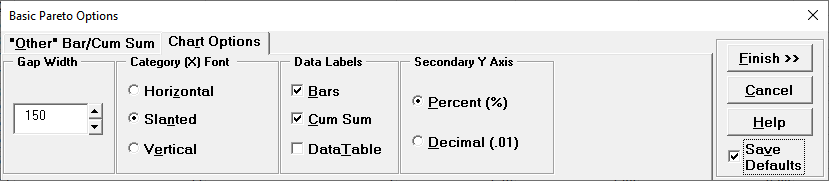
Tab Chart Options:
Category (X) Font Slanted Data Labels Check Bars, Cum Sum
Check Save Defaults.
Tip: After you have saved your defaults, you can bypass the above options,
by clicking
Finish instead of Next at the original Basic Pareto Chart
dialog box. The saved defaults will automatically be applied.
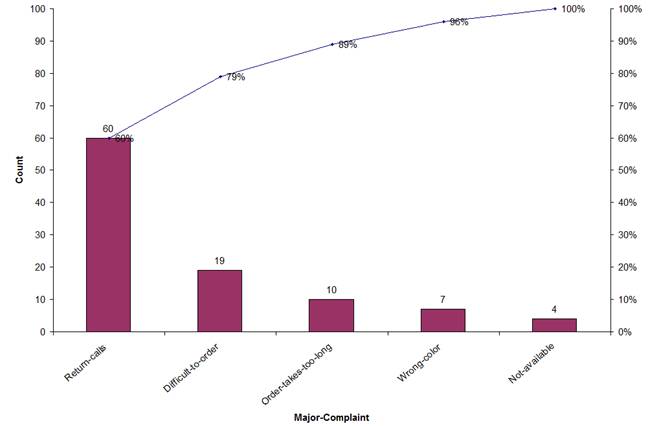
Click Finish. The Pareto Chart is produced:
Advanced (Multiple) Pareto Charts
Click Sheet1 Tab of
Customer Data.xlsx (or press F4 to activate last
worksheet).
Click SigmaXL > Graphical Tools > Advanced Pareto
Options.
Note that the Sample Charts have nothing to do with the data set being evaluated. They
are used to dynamically illustrate how your options affect the charts to be produced.
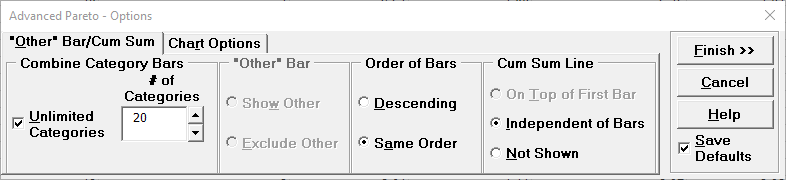
Set Order of Bars to Same Order on the
"Other Bar"/Cum Sum options tab.
This is typically used for comparative purposes. The Descending Order
option makes each Chart a true Pareto Chart, but is less useful for comparison.
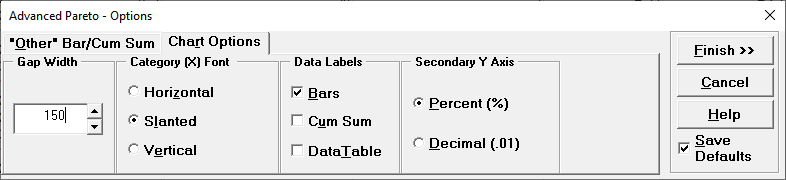
Click Chart Options tab. Set according to choice in this case we have selected
Data Labels for the Bars but not for the Cum Sum line.
Ensure that Save Defaults is checked. Note that
these options will be saved and applied to all Advanced Pareto Charts. Click
Finish.
SigmaXL automatically takes you to the next step of Chart
Generation (This is equivalent to clicking
SigmaXL > Graphical Tools > Advanced Pareto Charts). If
necessary, check
Use Entire Data Table.
Click Next.
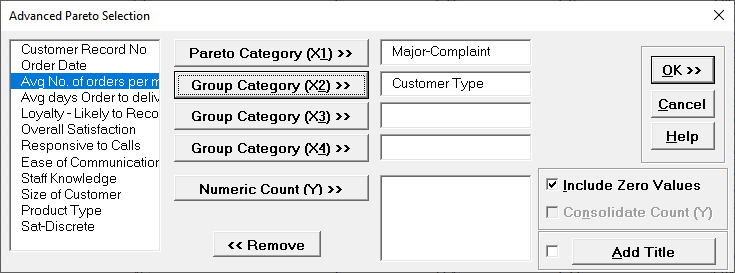
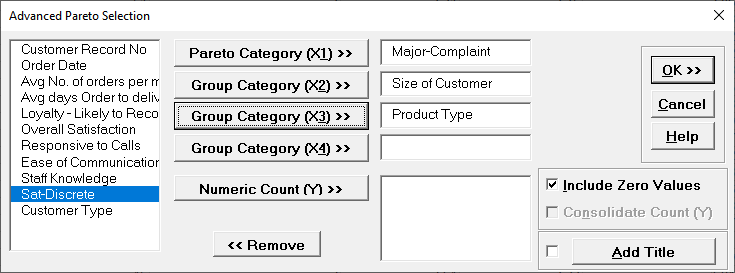
Select Major Complaint, click
Pareto Category (X1) >>; select Customer Type, click
Group Category (X2) >>.
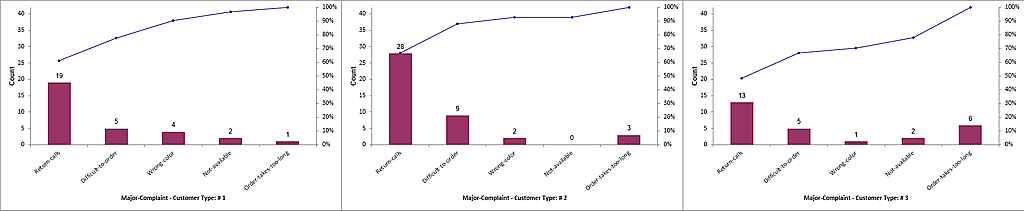
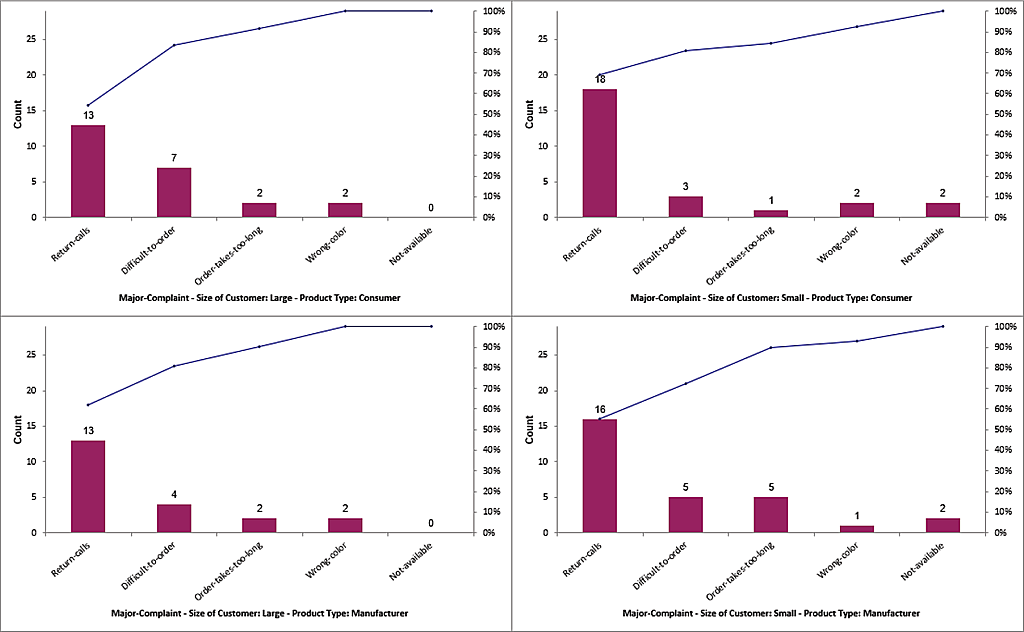
Click OK. A Pareto Chart of Major Customer
Complaints is produced for each Customer Type.
Ensure that entire data table is selected. If not, check
Use Entire Data Table. Click Next. (Steps 10 and 11
can be bypassed with the
Recall SigmaXL Dialog menu or by pressing
F3 to Recall Last Dialog).
Select Major Complaint, click
Pareto Category (X1) >>; select Size of Customer, click
Group Category (X2) >>; select Product Type, click
Group Category (X3) >>.
If a Numeric Count (Y) variable is not
specified, SigmaXL automatically determines the counts from the
Pareto Category (X1).
Normally we would use a text column of
discrete Xs, but be aware that numeric columns are also allowed.
Be careful here this could easily generate a very large number of
charts.
The total number of charts generated = (# of levels in X2) * (# of levels in X3) *
(# of levels in X4) * (# of Y variables).