
How Do I Calculate Power and Sample Size for a One Proportion Test?
To determine power and sample size for a one proportion test in SigmaXL, use either the Power & Sample Size Calculator or Power & Sample Size with Worksheet tools.
- Click SigmaXL > Statistical Tools > Power & Sample Size Calculators > 1 Proportion Test Calculator.
- Select Solve For Power (1−Beta). Enter
Sample Size and Alternative Proportion as shown:
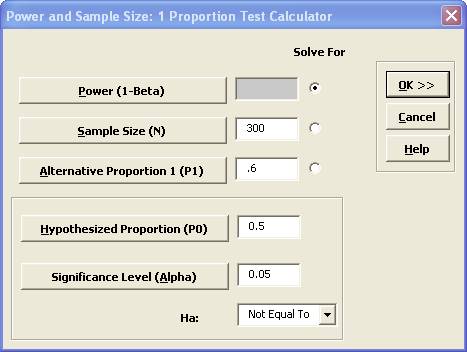
Note that we are calculating the power or likelihood of detection given that the hypothesized proportion is 0.5, but the alternative proportion is 0.6, sample size = 300, significance level = .05, and Ha: Not Equal To (two-sided test).
- Click OK. The resulting report is displayed:
- To determine Power & Sample Size using a Worksheet, click SigmaXL > Statistical Tools > Power & Sample Size with Worksheet > 1 Proportion Test.
- A graph showing the relationship between Power, Sample Size and Proportion Value can then be created using SigmaXL > Statistical Tools > Power & Sample Size Chart. See 1 Sample t-Test power and sample size example.
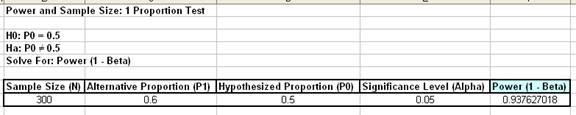
A power value of 0.94 is acceptable, but note that the
sample size n = 300, and the difference in proportion value is 0.1 or 10%! The
sample size requirements for discrete data are much higher than those for continuous
data.


