Two-Way ANOVA
- Home /
- Two Way ANOVA

Two-Way ANOVA tests the following:
H0 (Factor X1): μ1 = μ2 = … = μk
Ha (Factor X1): at least one pairwise set of means are not equal (μi ≠ μj);
H0 (Factor X2): μ1 = μ2 = … = μk
Ha (Factor X2): at least one pairwise set of means are not equal (μii ≠ μj);
H0 (Interaction): There is no interaction between factors X1 and X2
Ha (Interaction): There is an interaction between factors X1 and X2.
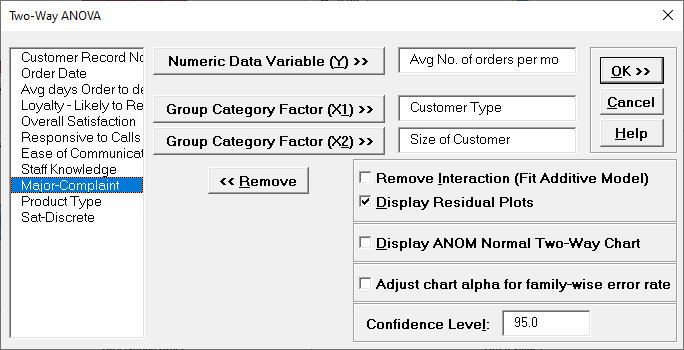
A Two-Way ANOVA analysis will typically have balanced data from a designed experiment, with an equal number of observations for each combination level of X1 and X2. SigmaXL will also accommodate unbalanced data. The minimum requirement is one observation per combination level of X1 and X2. An error message will be produced if this minimum requirement is not met.
Tip: If the Two-Way ANOVA report gives a p-value for the interaction that is high (> 0.1), you should then press F3 or click Recall SigmaXL Dialog to recall this dialog, check Remove Interaction (Fit Additive Model) and rerun the analysis.
Display ANOM Normal Two-Way Chart should be unchecked. We will discuss this tool later in Part P — Analysis of Means (ANOM) Charts. Note that this option is only available when Remove Interaction (Fit Additive Model) is unchecked because ANOM Normal Two-Way always includes the interaction term in the model. The ANOM alpha is (100 − Confidence Level)/100.
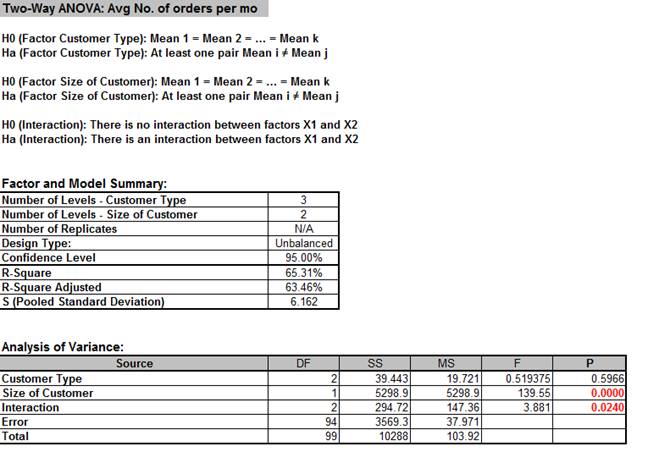
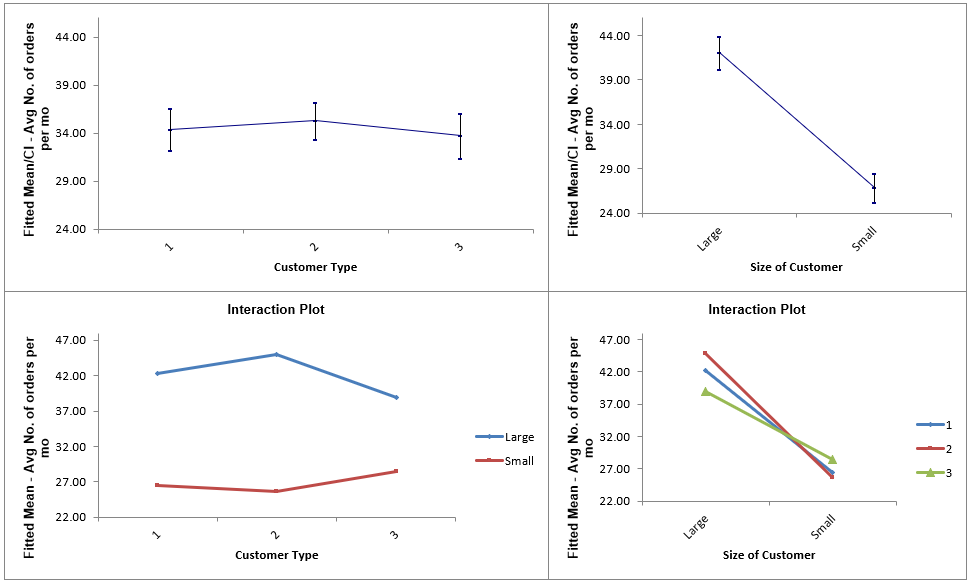
Note that the mean values shown are fitted (predicted least squares) means not data means. This compensates for unbalanced data.
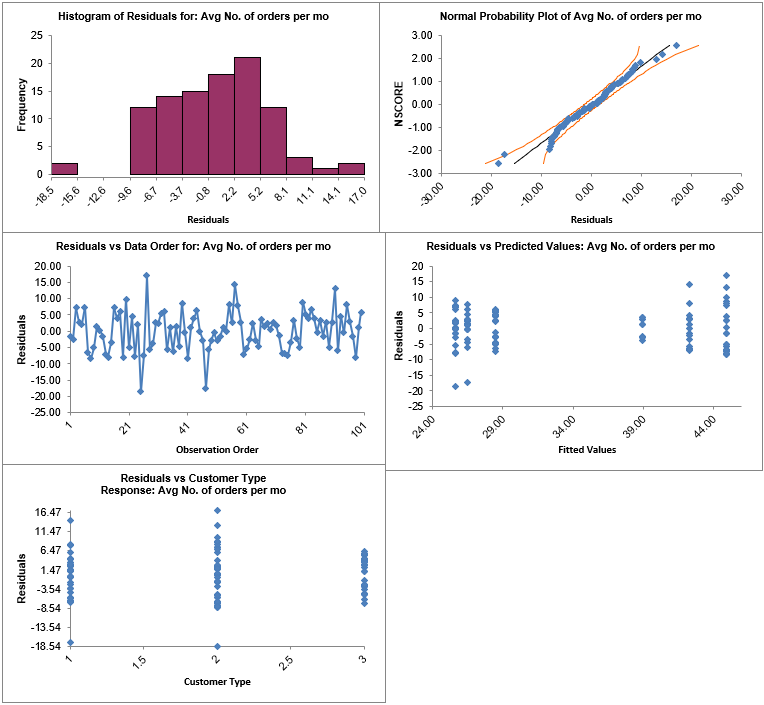
Residuals are the unexplained variation from the ANOVA model (Actual − Predicted/Fitted values). We expect to see the residuals approximately normally distributed with no obvious patterns in the above graphs, which is the case here.
The Residuals versus Size of Customer graph is not shown because Size of Customer is text. In order to display this plot, Size could be coded numerically with 1 = Small and 2 = Large. Simply create a new column called Size-Coded and use the following Excel formula to create the coded values for the first record:
=IF(K2="Small",1,IF(K2="Large",2))
Copy and Paste this formula to obtain coded values for all 100 records. Rerun the Two-Way ANOVA analysis to create the residual graphs.


