Normal Probability Plot
- Home /
- Normal Probability Plot

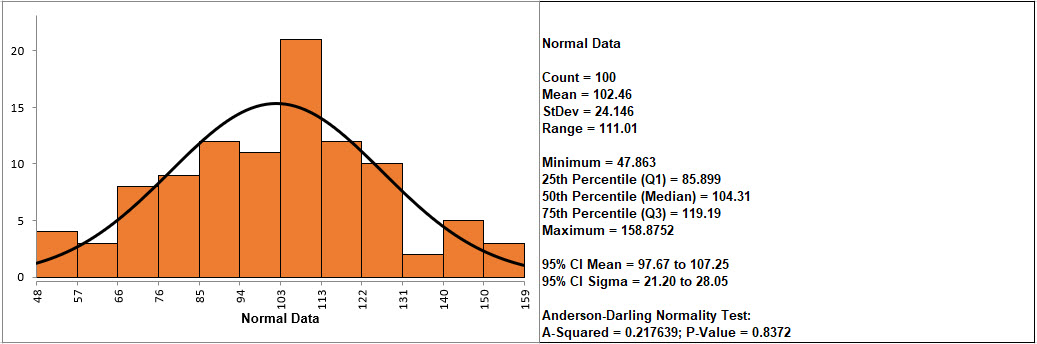
If the p-value of the Anderson-Darling Normality test is greater than or equal to .05, the data is considered to be normal (interpretation of p-values will be discussed further in Analyze).
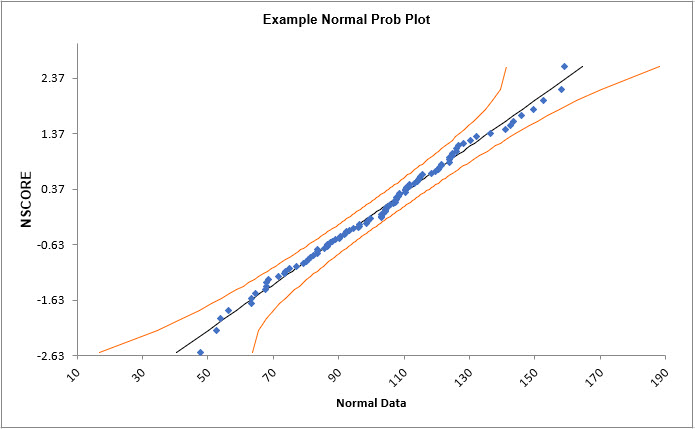
The data points follow the straight line fairly well, indicating that the data is normally distributed. Note that the data will not likely fall in a perfectly straight line. The eminent statistician George Box uses a “Fat Pencil” test where the data, if covered by a fat pencil, can be considered normal! We can also see that the data is normal since the points fall within the normal probability plot 95% confidence intervals (confidence intervals will be discussed further in Analyze).
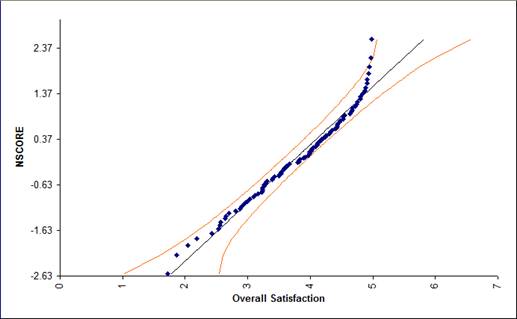
Is this data normally distributed? See earlier histogram and descriptive statistics of Customer Satisfaction data.
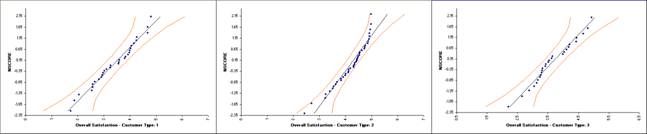
Reviewing these normal probability plots, along with the previously created histograms and descriptive statistics, we see that the satisfaction data for customer type 2 is not normal, and skewed left, which is desirable for satisfaction data! Note that although the customer type 2 data falls within the 95% confidence intervals, the Anderson Darling test from descriptive statistics shows p < .05 indicating non-normal data. Smaller sample sizes tend to result in wider confidence intervals, but we still see that the curvature for customer type 2 is quite strong.
Tip: Use the Normal Probability Plot (NPP) to distinguish reasons for nonnormality. If the data fails the Anderson Darling (AD) test (with p < 0.05) and forms a curve on the NPP, it is inherently nonnormal or skewed. Calculations such as Sigma Level, Pp, Cp, Ppk, Cpk assume normality and will therefore be affected. Consider transforming the data using LN(Y) or SQRT(Y) or using the Box-Cox Transformation tool (SigmaXL > Data Manipulation > Box-Cox Transformation) to make the data normal. Of course, whatever transformation you apply to your data, you must also apply to your specification limits. See also the Process Capability for nonnormal data tools.
If the data fails the AD normality test, but the bulk of the data forms a straight line and there are some outliers, the outliers are driving the nonnormality. Do not attempt to transform this data! Determine the root cause for the outliers and take corrective action on those root causes.


