Boxplots, also called box and whisker plots, are a powerful graphical tool for visualizing the distribution, spread, and outliers in your data. SigmaXL makes it easy to create boxplots directly in Excel without any complex setup. Boxplots are widely used in Six Sigma, quality control, and statistical analysis to compare group distributions at a glance.
Click Sheet 1 Tab of Customer
Data.xlsx (or press
F4 to activate last worksheet).
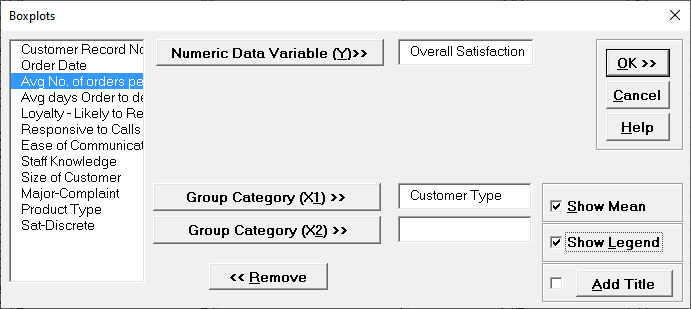
Click SigmaXL > Graphical Tools > Boxplots.
Ensure that entire data table is selected. If not, check
Use Entire Data Table. Click Next.
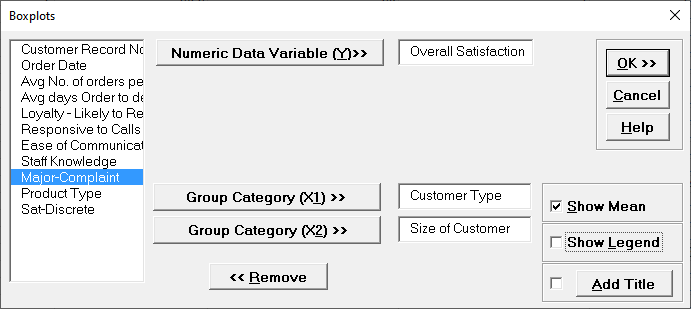
Select Overall Satisfaction, click
Numeric Data Variable (Y) >>, select Customer Type,
click
Group Category (X1) >>, check Show Mean, check
Show Legend:
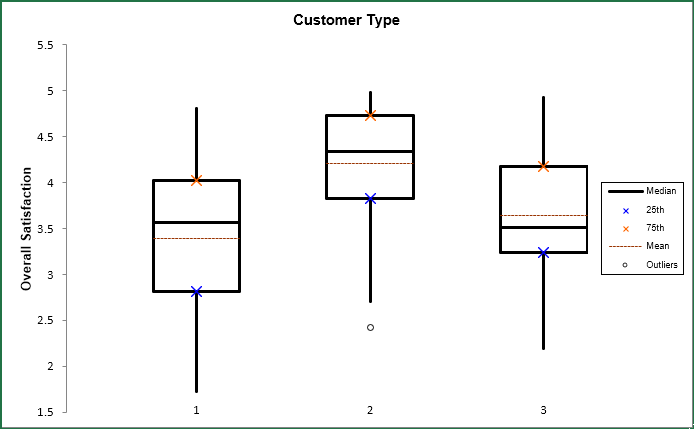
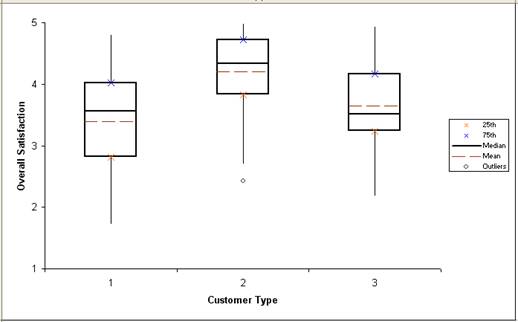
Click OK. A boxplot of Customer Satisfaction By
Customer Type is produced:
The legend indicates that the solid center line is the median. The
dashed red line shows the sample mean. The top of the box is the 75th percentile (Q3).
The bottom of the box is the 25th percentile (Q1). The height of the box is called the
Inter-Quartile Range (IQR) and is a robust measure of spread or sample variability. The
data point highlighted for Customer Type 2 is a potential outlier (< Q1 1.5 * IQR
or > Q3 + 1.5 * IQR). Note that extreme outliers are highlighted with a solid dot
(< Q1 3 * IQR or > Q3 + 3 * IQR).
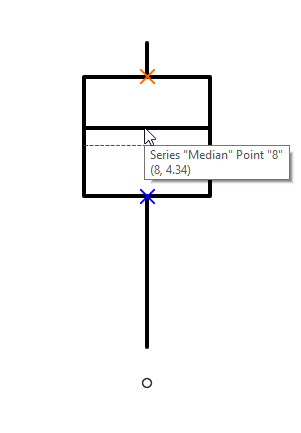
Tip: If you hover your mouse cursor in the middle of
any of the Boxplot lines as shown, you will see the balloon help indicating what the line is
and its numeric Y value.
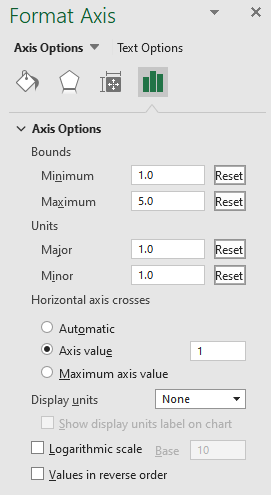
Now we will modify the Y axis scale, showing 1 as minimum and 5 as
maximum (given that the response data comes from a survey with 1-5 scale). To do this
right click on the Y axis and select Format Axis, modify the minimum value and maximum
value. Change
Horizontal axis crosses > Axis value to 1 as shown:
The Boxplot axis is modified as shown below:
Click Recall SigmaXL Dialog menu or press
F3 to Recall Last Dialog.
Select
Overall Satisfaction, click Numeric Data Variable (Y)
>>; select
Customer Type, click Group Category (X1) >>; select
Size of Customer, click Group Category (X2) >>; check
Show Mean; uncheck Show Legend:
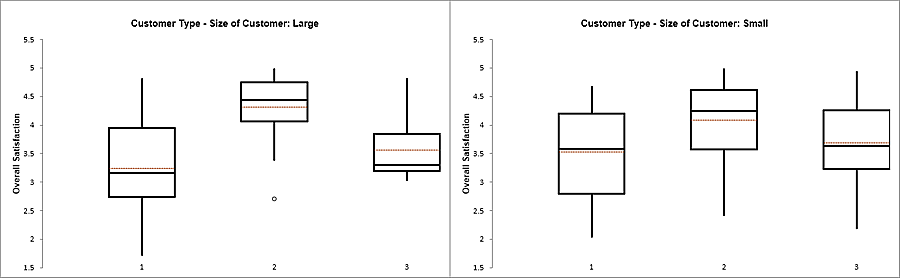
Click
OK. Boxplots of Customer Satisfaction By Customer Type and Size are
produced:
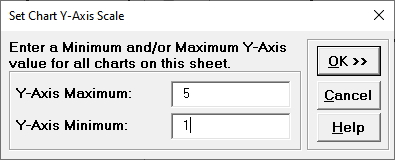
In order to adjust the Y-axis scale for
both charts, click SigmaXL Chart Tools > Set Chart
Y-Axis Max/Min.
Click
OK. The Y-axis scale maximum and minimum are now modified for both
charts.