Open ANOM Examples.xlsx, click on the Test Scores Binomial
Prop tab.
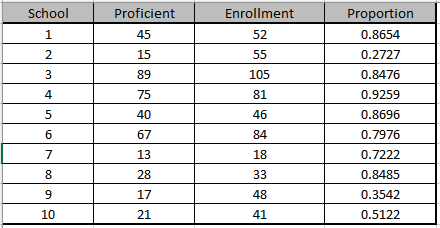
This is standardized math test score data from 10 elementary schools (Example 3.4
from the ANOM book used with author permission). We are testing to see if there is a
difference between schools at an alpha = 0.01 level.
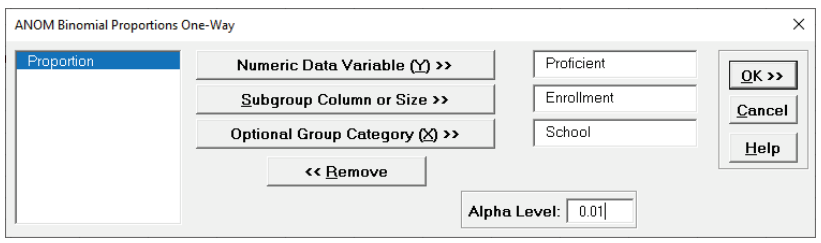
Click SigmaXL > Graphical Tools > Analysis of Means (ANOM) > ANOM
Binomial Proportions One-Way.
Ensure that the entire data table is selected. If not, check Use Entire Data
Table.
Click Next. Select Proficient, click Numeric Data
Variable (Y) >>;
select Enrollment, click Subgroup Column or Size >>;
select School,
click Optional Group Category (X) >>. Set Alpha
Level = 0.01:
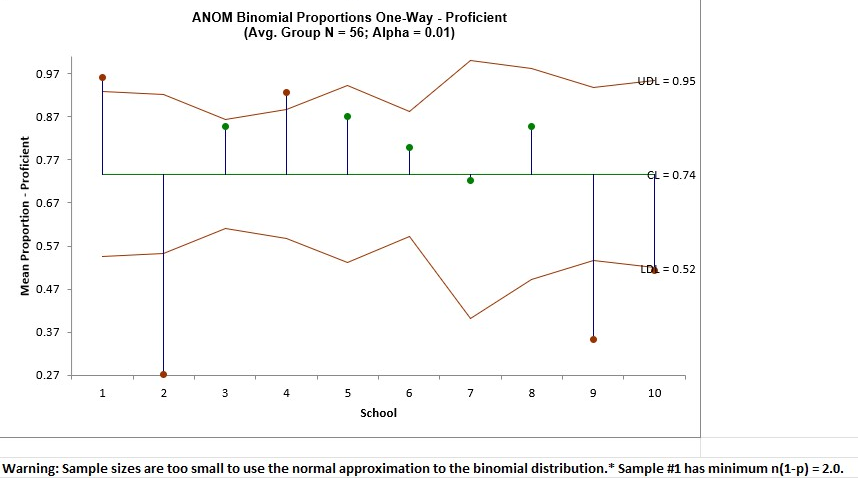
Click OK. The ANOM Binomial Proportions One-Way chart is shown below:
The resulting ANOM decision chart shows that three schools are performing at
significantly low levels and two schools are performing at significantly high levels.
SigmaXL automatically checks to see if the sample sizes are large enough for the normal
approximation to the Binomial to be valid, i.e., np and n(1-p) are > 5.
Here we see: Warning: Sample sizes are too small to use the normal approximation
to the binomial distribution.
Sample #1 has minimum n(1-p) = 2.0. Note that the warning does not show all
occurrences, just the sample(s) with smallest failed np or n(1-p).
This does not mean that the chart results are invalid, an obvious out or in will not
likely be affected, but the results should be used with caution, and if possible, more
data collected.