How Do I Perform ANOM Poisson Rate Two-Way in Excel Using SigmaXL?
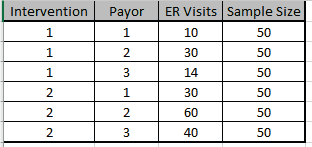
Open ANOM Examples.xlsx, click on the
ER Visits Poisson Rate tab. This is Emergency
Room
Visits Data. It is a factorial design study to investigate the
effect of nurse intervention (1 = home
nurse assigned, 2 = home nurse not assigned) and payor groups
(1, 2, 3) on the ER utilization
rates for patients with COPD (a serious lung disease) with an
alpha level = 0.01 (Example 5.16
from the ANOM book used with author permission).
Click SigmaXL > Graphical Tools > Analysis of
Means (ANOM) > ANOM Poisson Rates Two-
Way. Ensure that the entire data table is selected. If not, check
Use Entire Data Table.
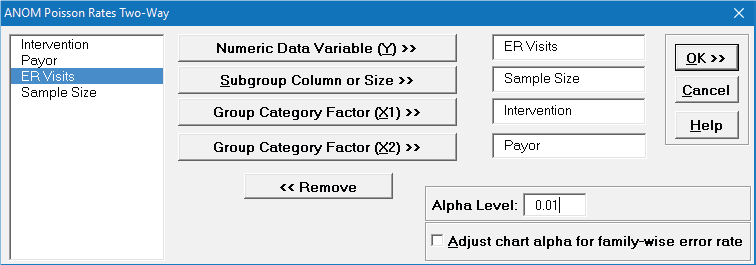
Click Next. Select
ER Visits, click Numeric Data Variable (Y) >>;
select Sample Size, click Subgroup Column or Size >>; select
Intervention, click Group Category Factor (X1) >>;
select Payor, click Group Category Factor (X2) >>.
Alpha Level = 0.01, Adjust chart alpha
for familywise
error rate is unchecked:
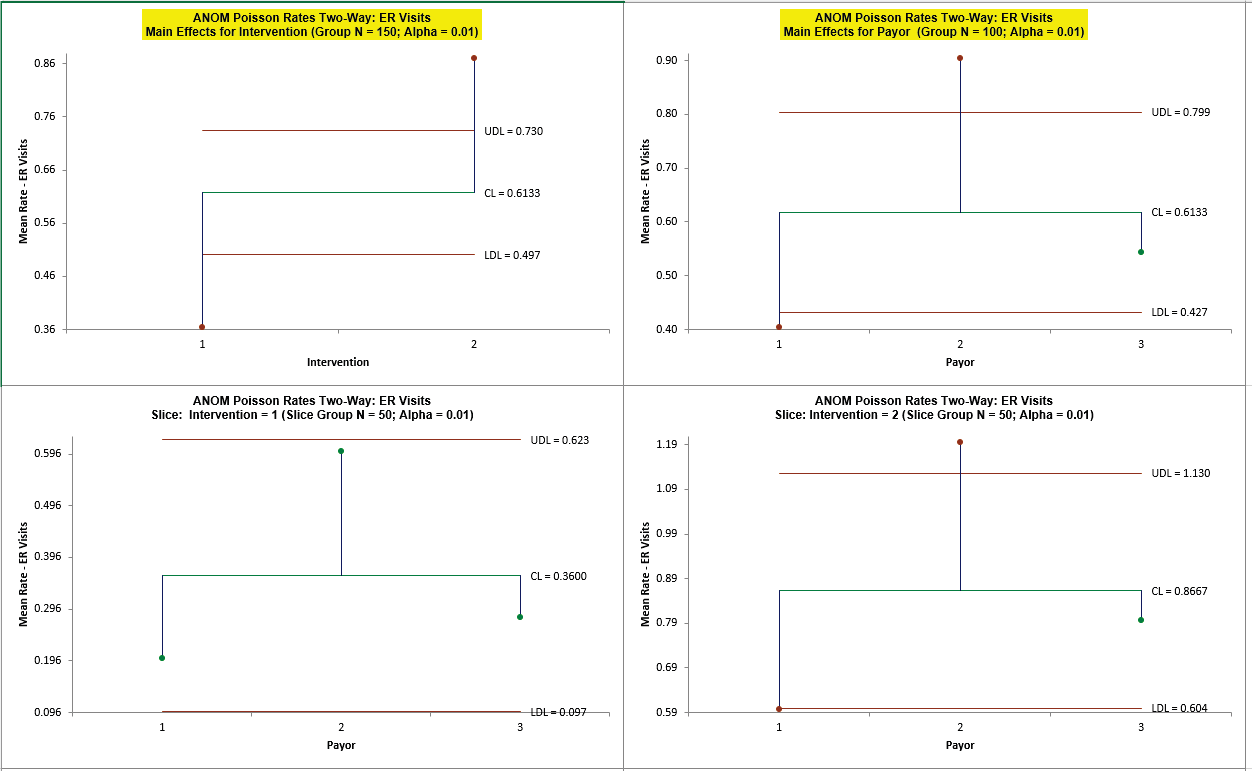
Click OK. The ANOM
Poisson Rates Two-Way Main Effects, Slice charts and Interaction
plots are
shown below:
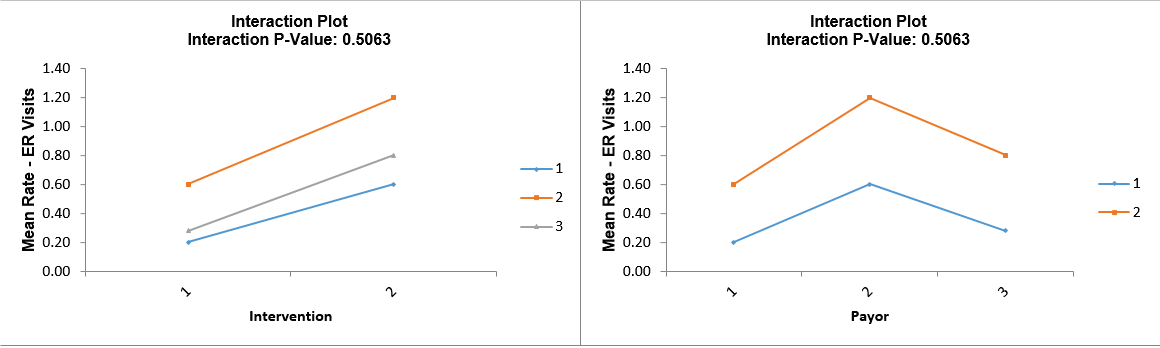
Since the Interaction is not significant (P-Value >= 0.1,
automatically determined from Poisson
regression), the Main Effects charts are highlighted. Both
factors Intervention and Payor are
significant at alpha = 0.01. Home nurse assigned results in a
significantly lower rate of ER
visits versus no home nurse assigned. Payor Type 1 has a
significantly lower rate of ER visits
and Type 2 has a significantly higher rate.