MSA Templates
Gage R&R Study (MSA) Example
Click SigmaXL > Templates & Calculators > Basic MSA Templates > Gage R&R Study
(MSA) to access the Gage R&R Study template.
The following example is given in the file Template & Calculator
Examples.xls. Click on the worksheet named Gage R&R. If
prompted, please ensure that macros are enabled.
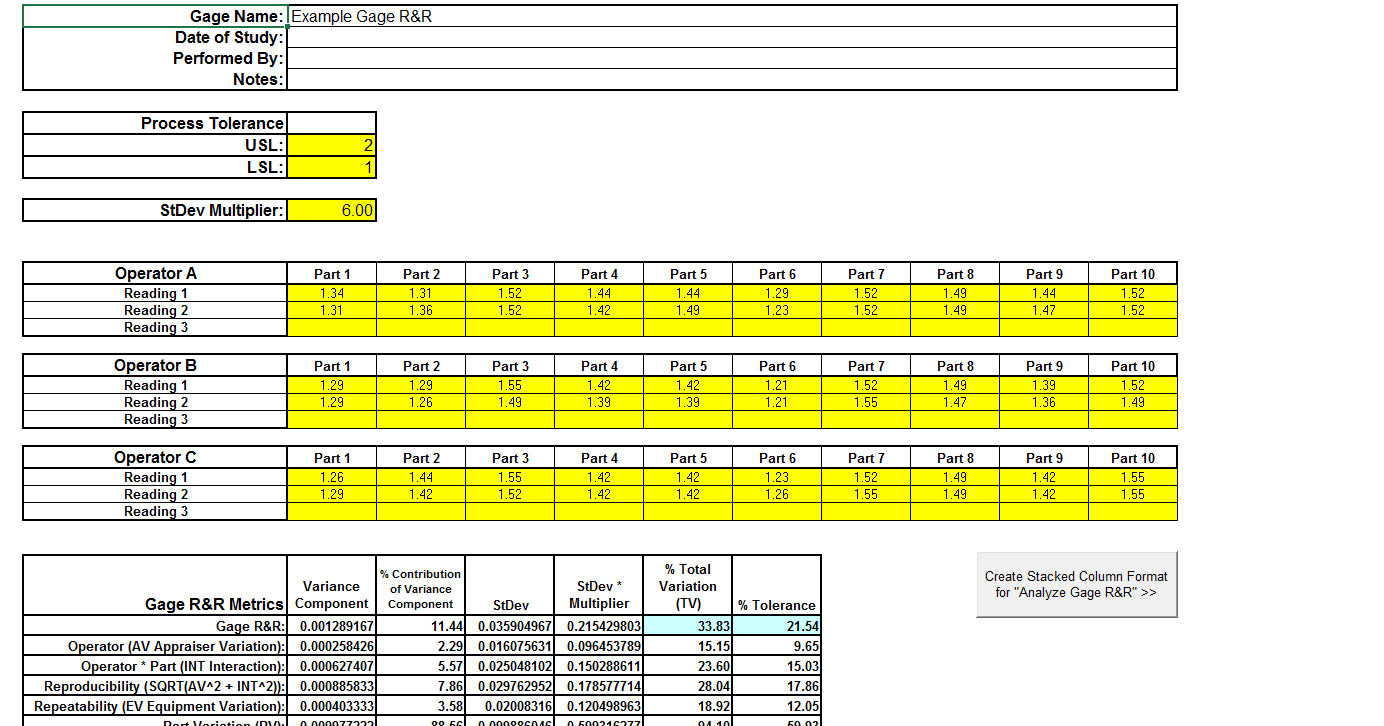
Notes for use of the Gage R&R Template:
- The Automotive Industry Action Group (AIAG) recommended study includes 10 Parts, 3
Operators and 3 Replicates. The template calculations will work with a minimum of 2
Operators, 2 Parts and 2 Replicates. The data should be balanced with each operator
measuring the same number of parts and the same number of replicates. Use
SigmaXL > Measurement Systems Analysis to specify up to 30 Parts, 10
Operators and 10 Replicates.
- Enter process Upper Specification Limit (USL) and Lower Specification Limit (LSL) in the
Process Tolerance window. This is used to determine the % Tolerance metrics. If the
specification is single-sided, leave both entries blank.
- The default StDev multiplier is 6. Change this to 5.15 if AIAG convention is being used.
- The cells shaded in light blue highlight the critical metrics Gage R&R % Total
Variation (also known as %R&R) and %Tolerance: < 10% indicates a good measurement
system;
> 30% indicates an unacceptable measurement system.
Gage R&R: Multi-Vari & X-bar R Charts Example
Click SigmaXL > Templates & Calculators > Basic MSA Templates > Gage R&R: Multi-Vari
& X-bar R Charts to access the Multi-Vari & X-bar R Charts template. An example
is given in the file Template & Calculator Examples.xls. Click on the
worksheets named Gage R&R - Multi-Vari and Gage R&R X-Bar R:
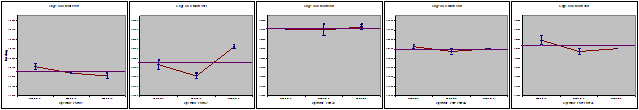
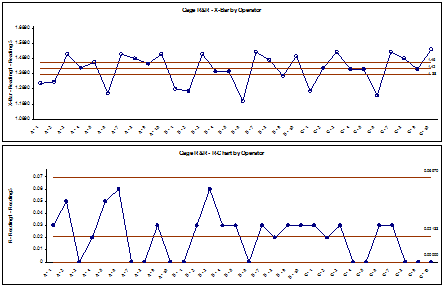
Notes for use of the Gage R&R: Multi-Vari & X-bar R Charts:
- The Gage R&R Multi-Vari and X-bar & R charts can only be generated if a Gage
R&R template has been completed and is the active worksheet. Select the Gage R&R
worksheet and click
SigmaXL > Templates & Calculators > Gage R&R: Multi-Vari &
X-Bar R Charts to create the above charts.
- The Multi-Vari chart shows each Part as a separate graph. Each Operators response
readings are denoted as a vertical line with the top tick corresponding to the Maximum
value, bottom tick is the Minimum, and the middle tick is the Mean. The horizontal line
across each graph is the overall average for each part.
- When interpreting the X-bar and R chart for a Gage R&R study, it is desirable that
the X-bar chart be out-of-control, and the Range chart be in-control. The control limits
are derived from within Operator repeatability.
Attribute Gage R&R (MSA) Example
Click SigmaXL > Templates & Calculators > Basic MSA Templates > Attribute
MSA to access the Attribute MSA Study template. Click on the worksheet named
Attribute MSA.
Notes for use of the Attribute Gage R&R (MSA) Template:
- Attribute Gage R&R is also known as Attribute Agreement Analysis.
- Recommend for study: 3 Appraisers, 2 to 3 Replicates, Minimum of 10 Good Parts and 10
Bad Parts. The data should be balanced with each appraiser evaluating the same number of
parts and the same number of replicates.
- Specify the Good Part or Unit as G or other appropriate text (P, Y, etc.). Specify the
Bad Part or Unit as NG or other appropriate text (F, N, etc.). Be careful to avoid
typing or spelling errors when entering the results. A space accidentally inserted after
a character will be treated as a different value leading to incorrect results.


