Ensure that entire data table is selected. If not, check Use Entire Data Table. Click Next.
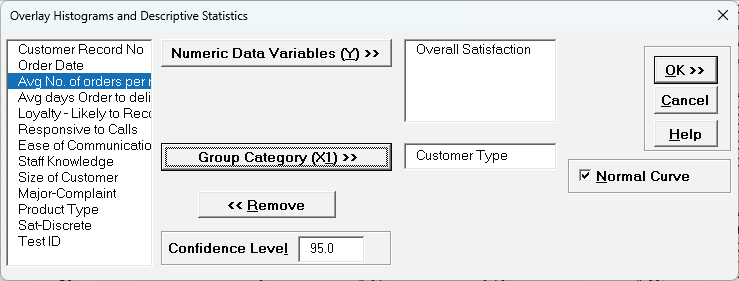
Select Overall Satisfaction, click Numeric Data Variables (Y) >>, select Customer Type, click Group Category (X1) >> as shown:
Note: A maximum of 5 Numeric Data Variables or 5 Group Category levels are permitted. We recommend using this to compare 2 or at most 3 variables/levels.
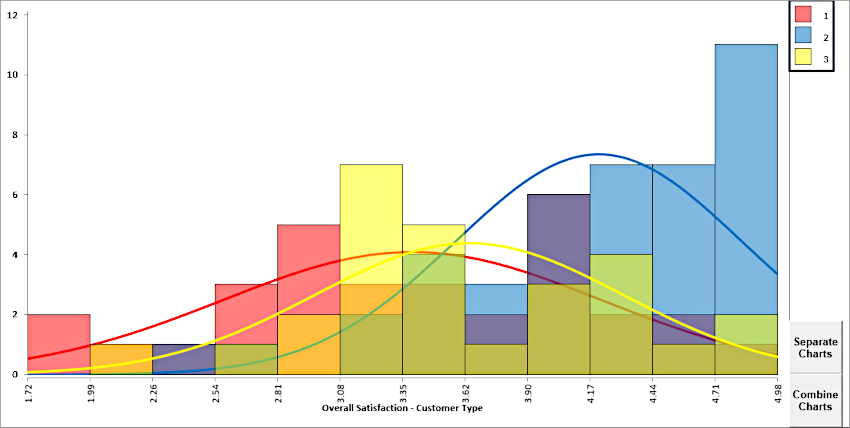
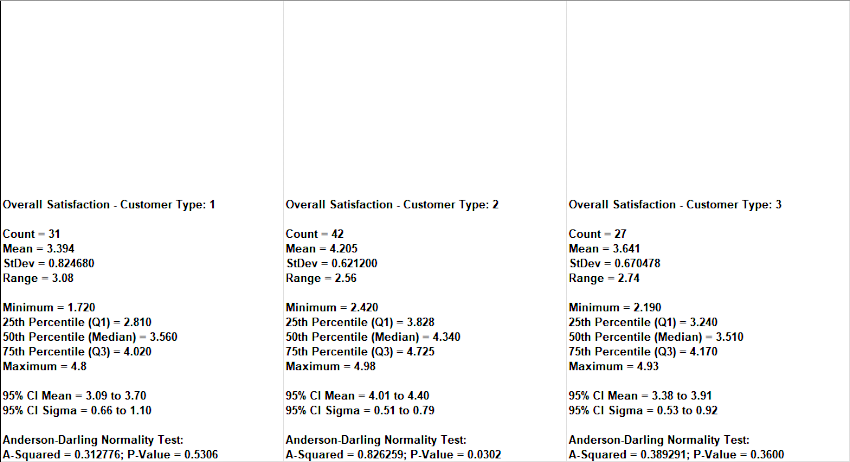
Click OK. Overlay Multiple Histograms and Descriptive Statistics of Customer Satisfaction By Customer Type are produced:
The Histograms and Descriptive Statistics can be separated and combined. Colors and Transparency levels can be adjusted using Excel's Format Chart Area tool.
Open the file Catapult Data-Before After Improvement.xlsx.
Ensure that entire data table is selected. If not, check Use Entire Data Table.
Click Next.
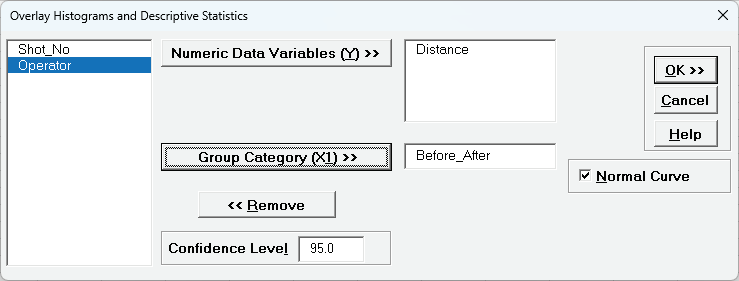
Select Distance, click Numeric Data Variables (Y) >>, select Before_After, click Group Category (X1) >> as shown:
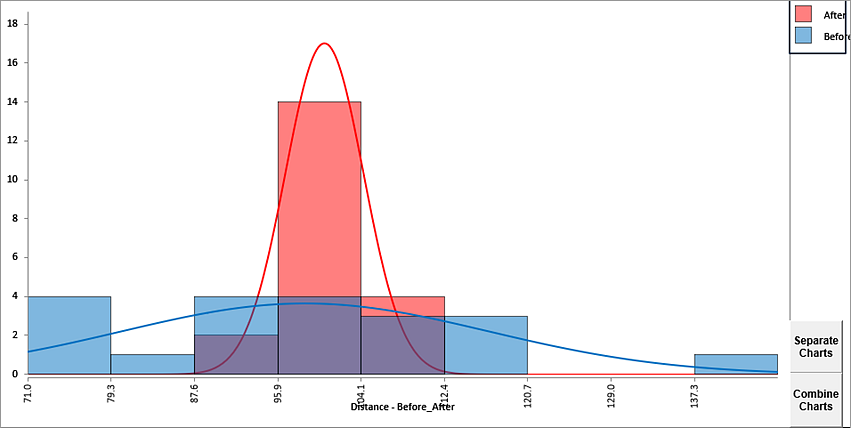
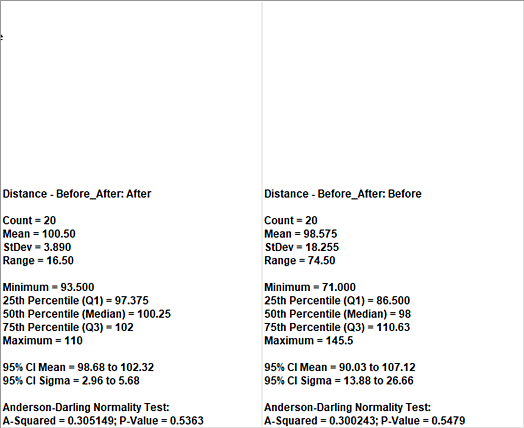
Click OK. Overlay Multiple Histograms and Descriptive Statistics of Distance by Before/After Improvement are produced:
As previously noted, Histograms and Descriptive Statistics can be separated and combined. This is a useful graphical complement to any two-sample statistical test.