Company
About Us
Clients
News
Testimonials
Training Partners
Partners Login
Products
SigmaXL
DiscoverSim
Current Versions
Register Product
Downloads
SigmaXL Trial
DiscoverSim Trial
Web Demos
Additional Resources
Pricing
SigmaXL Pricing
DiscoverSim Pricing
Request a Quote
Order
Order SigmaXL Licenses
Order DiscoverSim License
Payment Options
International Distributors
Request A Quote
Help & Support
System Requirements
SigmaXL Guide
DiscoverSim Guide
Feedback
PDF Downloads
YouTube
Search SigmaXL
Product Activation FAQs
Registration Portal
Help Desk
Live Help
Contact Us
Contact Us
Chat Now
Overlay Run Chart
Home
/
Overlay Run Chart
How Do I Create Overlay Run Charts in Excel Using SigmaXL?
Click
Sheet 1
Tab of
Customer Data.xlsx
. Click
SigmaXL > Graphical Tools > Overlay Run Chart
.
Ensure that the entire data table is selected. If not, check
Use Entire Data Table
. Click
Next
.
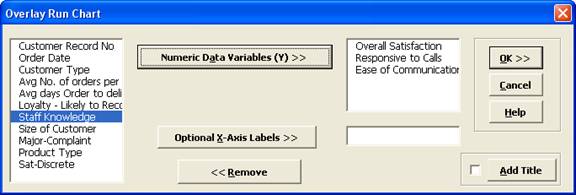
Select
Overall Satisfaction
,
Responsive to Calls
and
Ease of Communications
. Click
Numeric Data Variable (Y) >>
.
Click
OK
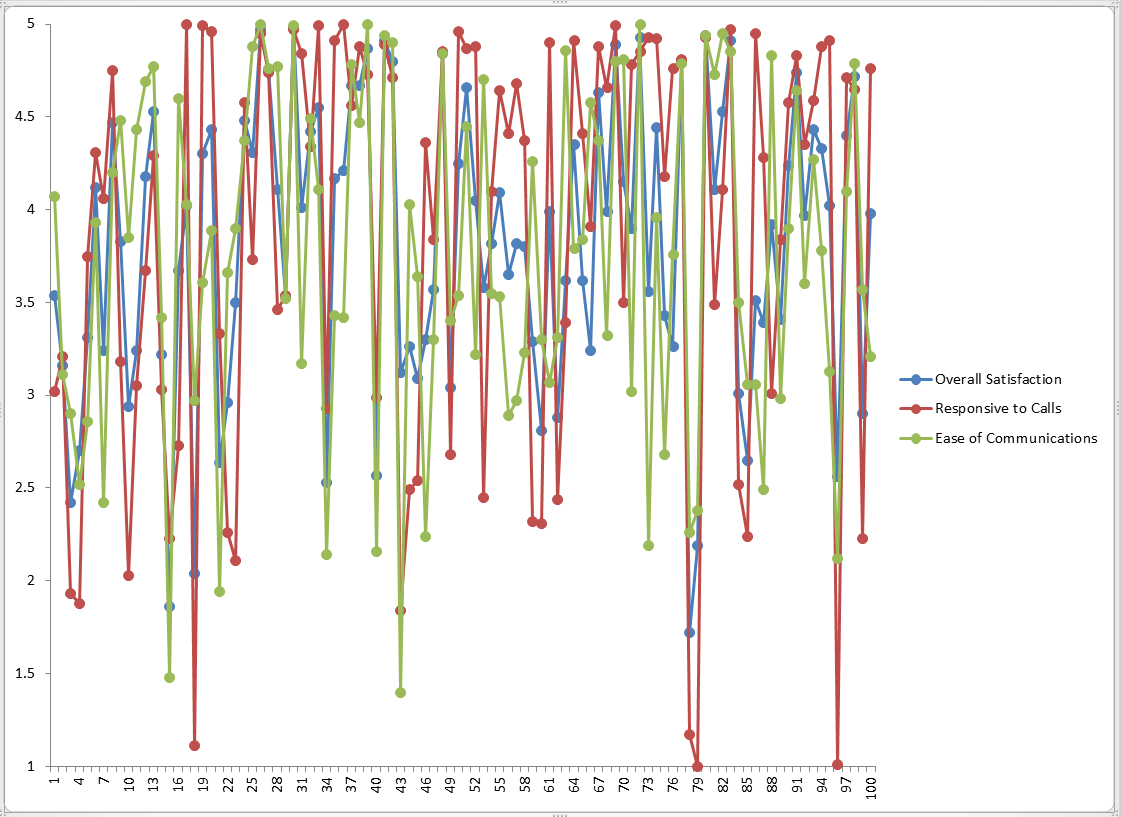
. An Overlay Run Chart of
Overall Satisfaction
,
Responsive to Calls
and
Ease of Communications
is produced.
Define, Measure, Analyze, Improve, Control
Download Free Trial Now
Simulate, Optimize, Realize
Download Free Trial Now
X