P' and U' (Laney) Control Charts are attribute control charts that should be used when the
subgroup/sample size is very large (i.e. > 5,000) and assumptions are not met. Typically you
will see that the control limits do not look right, being very tight with many data points
appearing to be out-of-control. This problem is also referred to as overdispersion. This
occurs when the assumption of a Binomial distribution for defectives or Poisson distribution
for defects is not valid. Individuals charts are often recommended in these cases, but
Laneys P and U charts are a preferred alternative.
U'- Charts
- Open Attribute Data U Defects - Crossley.xlsx. This data is used with permission from Mark Crossley and was used in the example given in reference [1]. Note that there are multiple defects per unit.
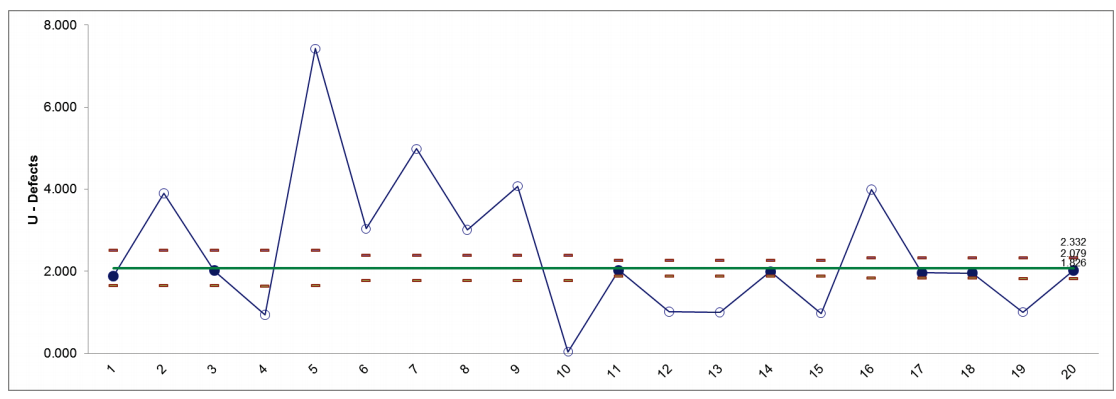
- We will begin with the creation of a regular U-Chart for this data. Select SigmaXL > Control Charts > Attribute Charts > U. Ensure that the entire data table is selected. If not, check Use Entire Data Table. Click Next.
- Select Defects as the Numeric Data Variable (Y) >>, N as the Subgroup Column (Size) . Click OK. The resulting U-Chart is shown:
- Select Sheet U' Chart Defects - Crossley. Click SigmaXL > Control Charts > Attribute Charts > U (Laney). Click Next.
- Select Defects, click Numeric Data Variable (Y) >>; select N, click Subgroup Column or Size >>. (If we had a fixed subgroup size, the numerical value of the subgroup size could be entered instead of Column N.) Check Tests for Special Causes.
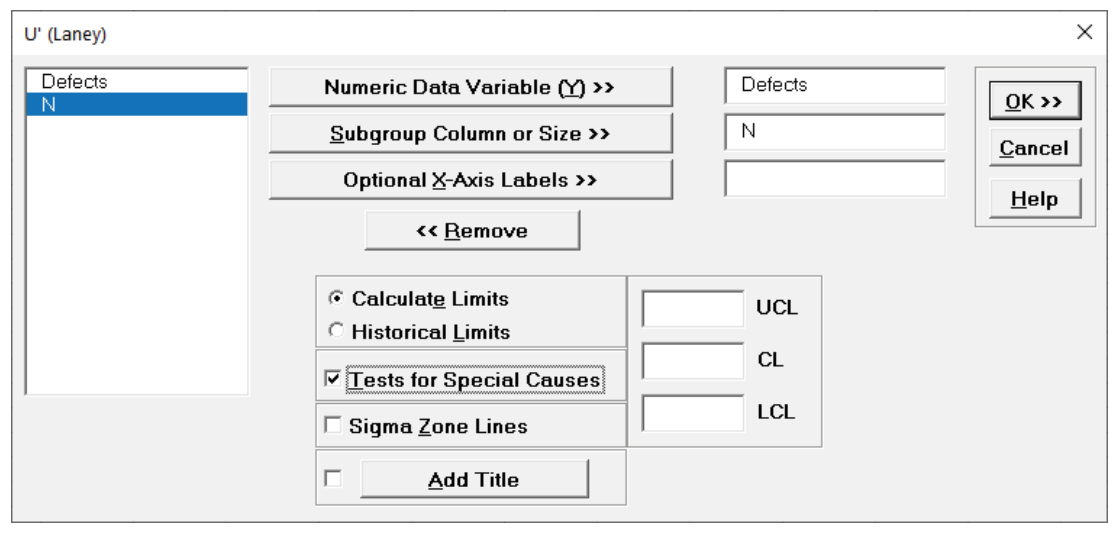
- Click OK. The resulting U'-Chart is shown:
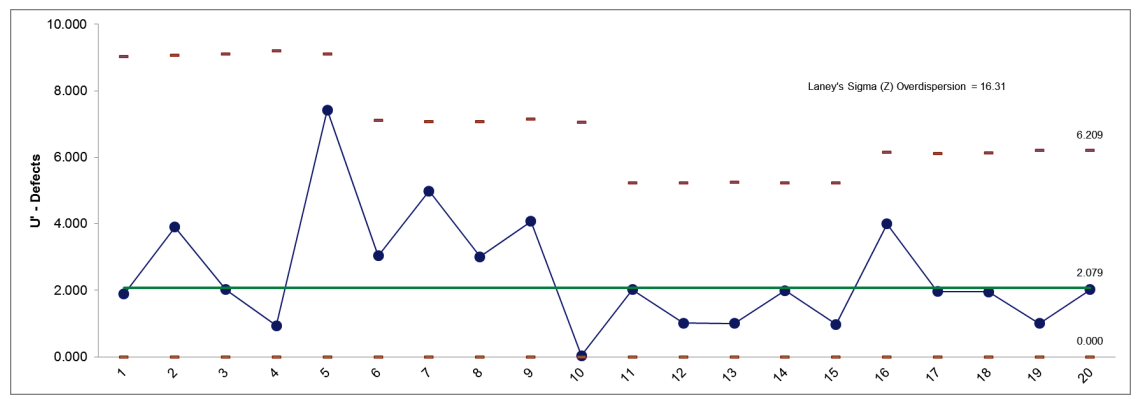
- Now we see that the process is actually in-control. Laneys Sigma (Z) is a measure of the overdispersion. See reference [1] for further details.
References:
- Laney, David B., P-Charts and U-Charts Work (But Only Sometimes), Quality Digest, http://www.qualitydigest.com/currentmag/departments/what_works.shtml
- Laney, David B., Improved Control Charts for Attribute Data, Quality Engineering 2002;14:5317.
- M A Mohammed and D Laney, Overdispersion in health care performance data: Laneys approach, Qual. Saf. Health Care 2006;15;383-384.


