Create a Basic Histogram in Excel Using SigmaXL
- Home /
- Basic Histogram

SigmaXL makes it easy to create a professional frequency distribution histogram directly inside Microsoft Excel. Whether you are working on a Six Sigma project, statistical process control analysis, or visualizing customer survey data, the Basic Histogram tool provides flexible bin width controls, normal curve overlay, and instant chart generation without leaving your spreadsheet.
Click Sheet 1 Tab of Customer Data.xlsx (or press F4 to activate last worksheet).
Click SigmaXL > Graphical Tools > Basic Histogram.
Ensure that the entire data table is selected. If not, check Use Entire Data Table. Click Next.
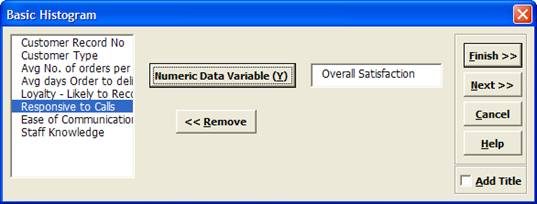
Select Overall Satisfaction, click Numeric Data Variable (Y) >> as shown:
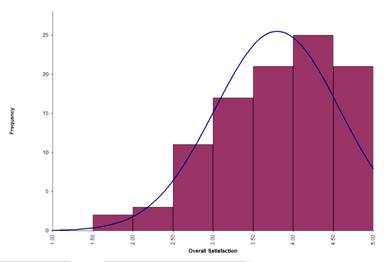
Tip: Any graph produced by SigmaXL can be
Copied/Pasted into Word. It can also be enlarged by clicking on the graph and dragging the
corner. The number of decimal places displayed can be modified by clicking on the Axis Label
and selecting the
Number tab to adjust. The text label alignment can
also be modified by selecting the Alignment tab.
The Basic Histogram in SigmaXL is a powerful yet simple tool for anyone performing quality analysis or Six Sigma studies in Excel. Download the free trial to explore histograms and dozens of other statistical graphical tools today.


