DMAIC Templates
- Home /
- DMAIC Templates

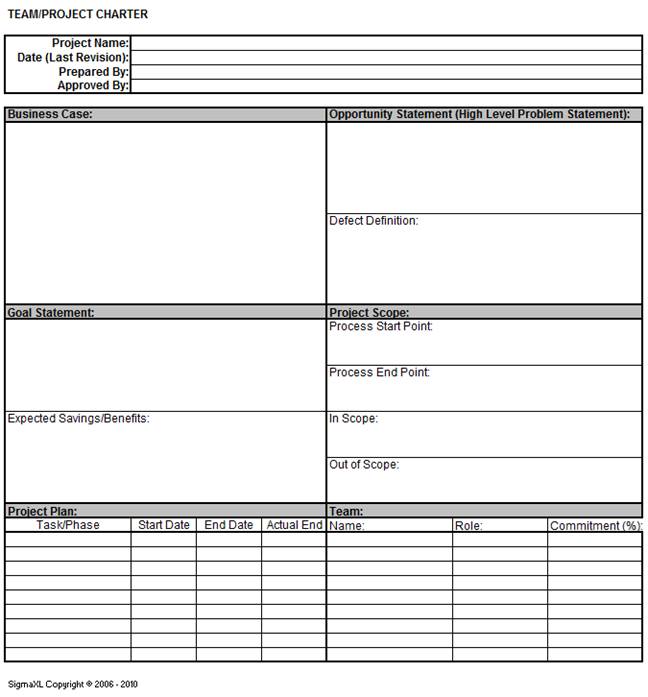
Click SigmaXL > Templates & Calculators > DMAIC & DFSS Templates > Team/Project Charter to access the Team/Project Charter template.
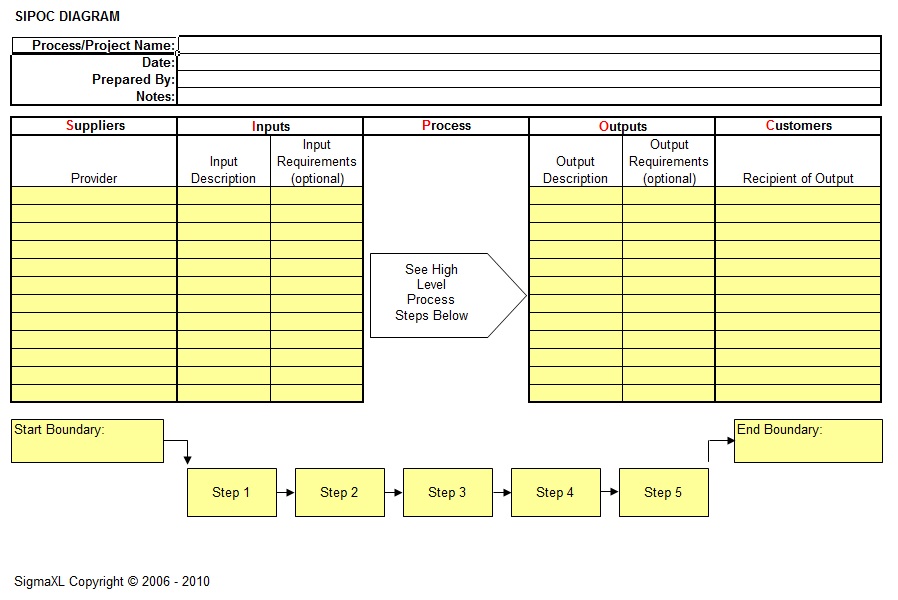
Click SigmaXL > Templates & Calculators > DMAIC & DFSS Templates > SIPOC Diagram to access the SIPOC Diagram template.
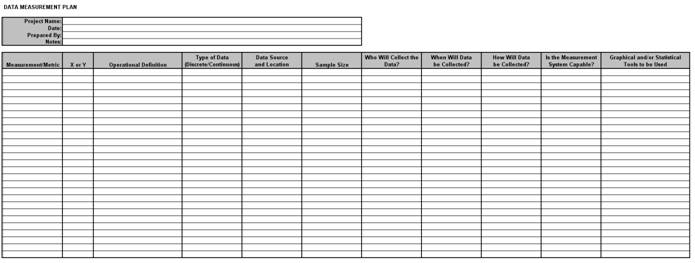
Click SigmaXL > Templates & Calculators > DMAIC & DFSS Templates > Data Measurement Plan to access the Data Measurement Plan template.
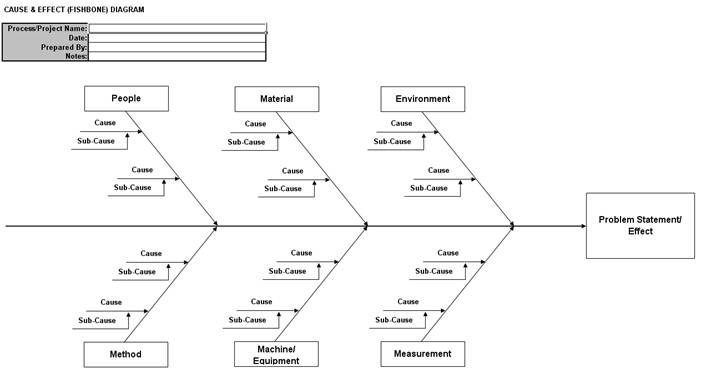
Click SigmaXL > Templates & Calculators > DMAIC & DFSS Templates > Cause & Effect (Fishbone) Diagram to access the Cause & Effect Diagram form.
Notes:
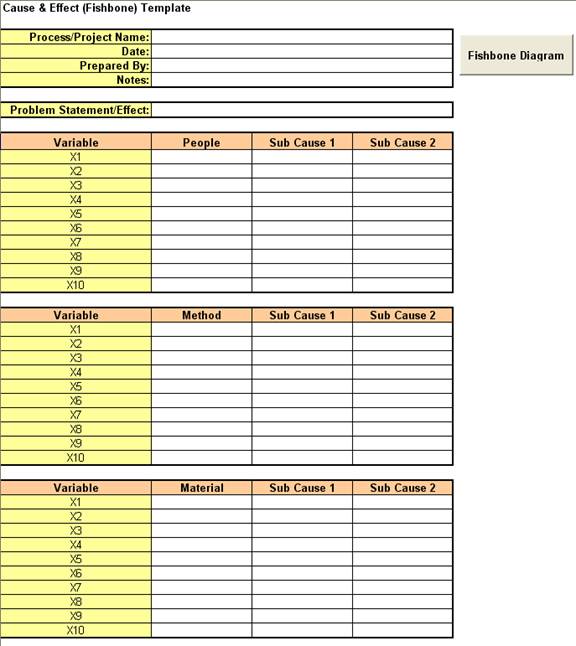
Click SigmaXL > Templates & Calculators > DMAIC & DFSS Templates > Cause & Effect (Fishbone) Template to access the Cause & Effect Diagram template.
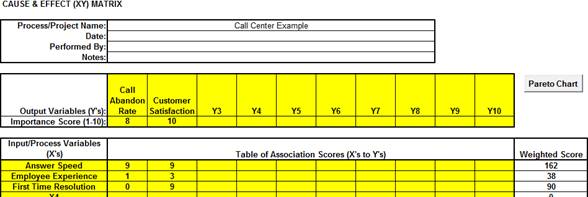
Click SigmaXL > Templates & Calculators > DMAIC & DFSS Templates > Cause & Effect (XY) Matrix to access the Cause & Effect (XY) Matrix template.
This is a simple Cause and Effect Matrix example for a Call Center. If prompted, please ensure that macros are enabled in order to allow Pareto Charts to be created.
Notes:
Click SigmaXL > Templates & Calculators > DMAIC & DFSS Templates > Failure Mode & Effects Analysis (FMEA) template.
This is a simple Failure Mode and Effects example for Stocking Inventory. If prompted, please ensure that macros are enabled in order to allow sort by RPN.
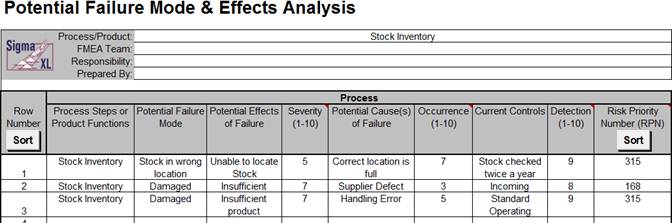
If you hover the mouse cursor over the Severity, Occurrence or Detection heading the recommended scale will appear as a comment:
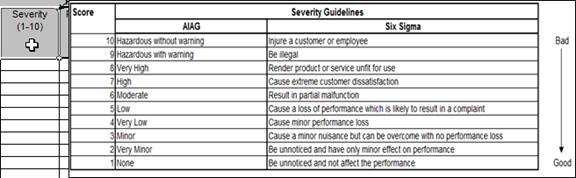
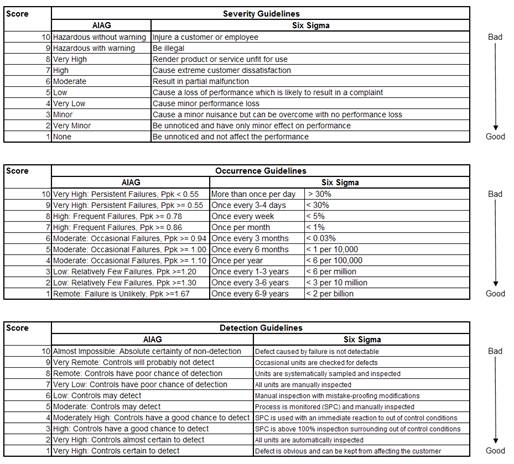
The recommended scales for Severity, Occurrence, and Detection are shown below:
Click Risk Priority Number (RPN) Sort to sort the rows by RPN in descending order.

Click Revised Risk Priority Number Sort to sort the rows by Revised RPN in descending order.

Click Row Number Sort to restore the FMEA worksheet to the original row order (ascending).

Click SigmaXL > Templates & Calculators > DMAIC & DFSS Templates > Quality Function Deployment (QFD) > 10 by 10 QFD (or 20 by 20, 30 by 30) to access the Quality Function Deployment (QFD) template. Enter data as shown.
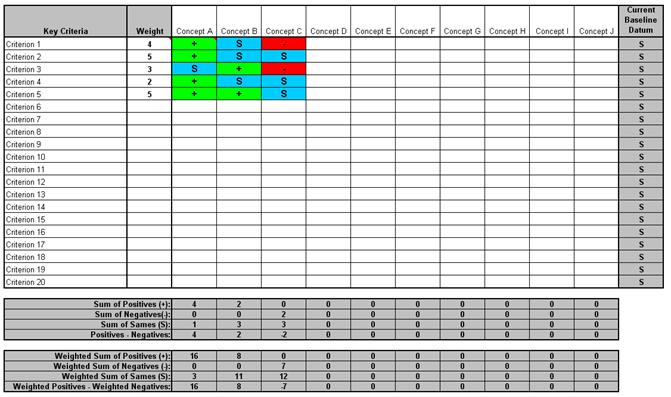
Click SigmaXL > Templates & Calculators > DMAIC & DFSS Templates > Pugh Concept Selection Matrix to access the Pugh Concept Selection Matrix template. Enter data as shown.
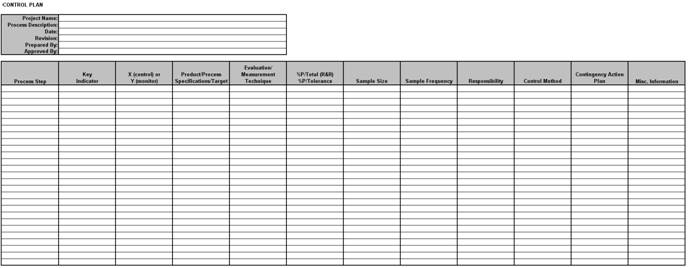
Click SigmaXL > Templates & Calculators > DMAIC & DFSS Templates > Control Plan to access the Control Plan template.