Graphical Templates
- Home /
- Graphical Templates

Click SigmaXL > Templates & Calculators > Basic Graphical Templates > Pareto Chart. Enter data as shown:
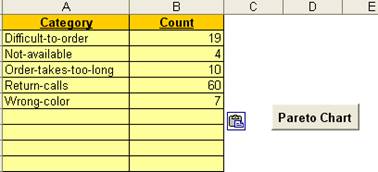
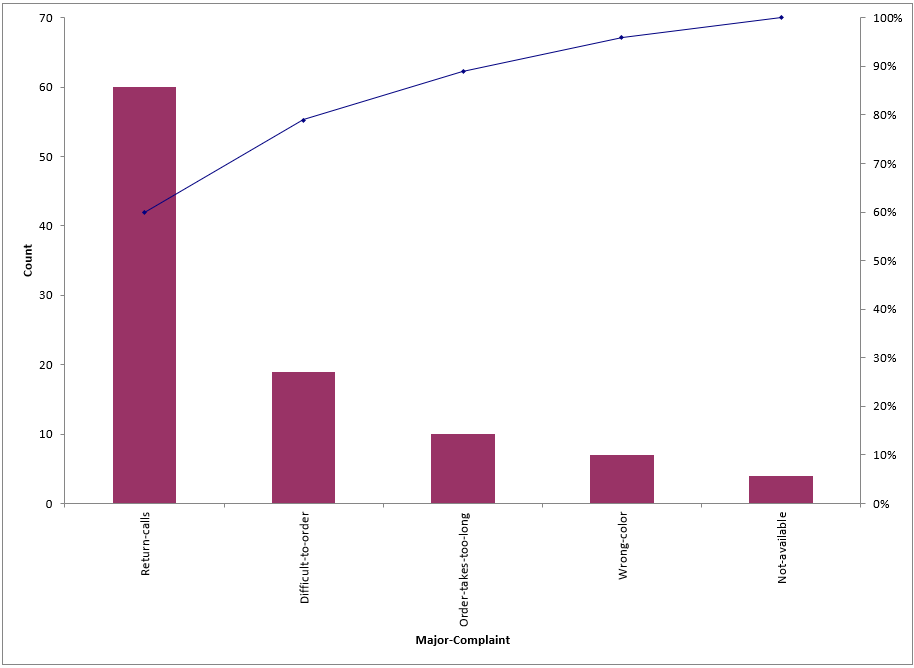
Click the Pareto Chart button to produce the Pareto Chart:
Notes:
1. This Pareto Chart template should be used with count data like number of errors. You can also create Pareto charts with cost data.
2. You can replace the Category and Count column headings with any headings that you wish.
3. Enter the Pareto categories in the Category column. These can be Name, Location, Error Type or other text information. Pareto categories are required and will appear on the horizontal X-Axis of the Pareto Chart.
4. Enter your count (or cost) data in the Count column.
5. Click the Pareto Chart button to create a Pareto Chart.
Click SigmaXL > Templates & Calculators > Basic Graphical Templates > Histogram. Enter data as shown:
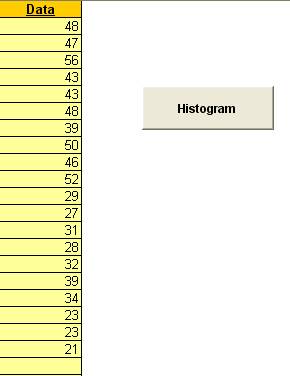
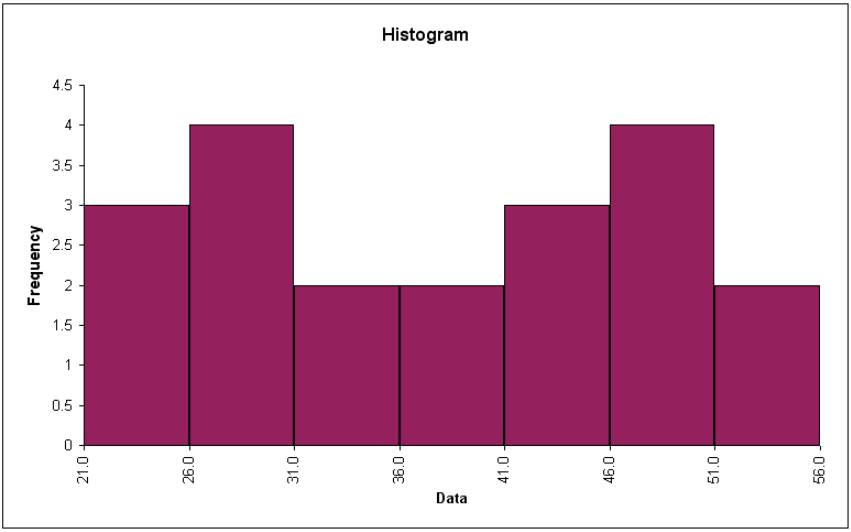
Click the Histogram button to produce the Histogram:
Notes:
Click SigmaXL > Templates & Calculators > Basic Graphical Templates > Run Chart. Enter the data as shown (copy and paste the histogram data):
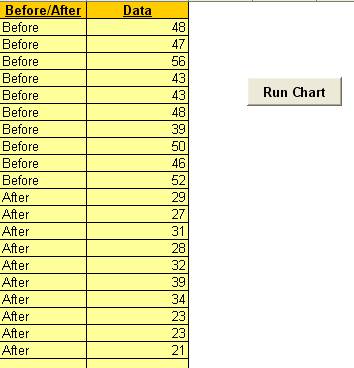
Click the Run Chart button to produce the Run Chart:
Notes:


