Taguchi L9 (3 Level) Four Factor - Paper Airplane Example
This Paper Airplane Experiment is adapted from the article "Teaching Taguchi's Approach to Parameter Design", by Sanjiv Sarin, Quality Progress, May 1997.
Click SigmaXL > Help > Template Examples > Taguchi Examples > L9 Four Factor - Paper Airplane to open the example file. If you wish to start with a blank template and populate the values, click SigmaXL > Design of Experiments > Basic Taguchi DOE Templates > Taguchi L9 (3 Level) > Four Factor.
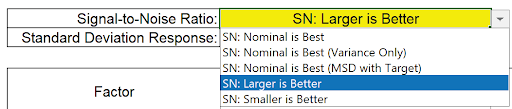
The response is Distance of Flight in Inches. The goal is to maximize Distance.
We will maximize the Signal-to-Noise Ratio SN: Larger is Better, selected from the list as shown:
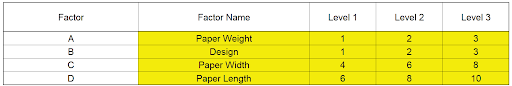
The Inner Array Controllable Input factors used in this study are: Paper Weight (1 Sheet, 2 Sheets, 3 Sheets), Design (Design 1, Design 2, Design 3), Paper Width (4 inches, 6 inches, 8 inches) and Paper Length (6 inches, 8 inches, 10 inches).
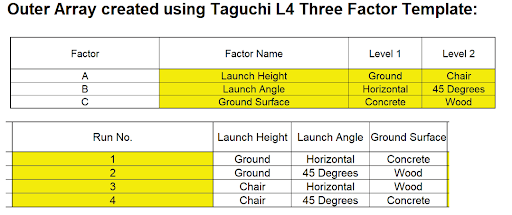
The Uncontrollable Factors are Launch Height, Launch Angle and Ground Surface. The Outer Array was created using an L4 Three Factor design. Scroll right to view the screen capture:
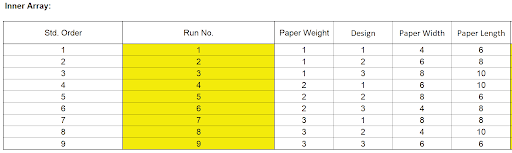
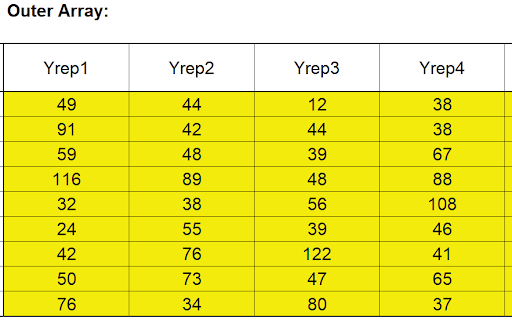
The distance values are entered into the Outer Array of the L9 as Yrep1 to Yrep4:
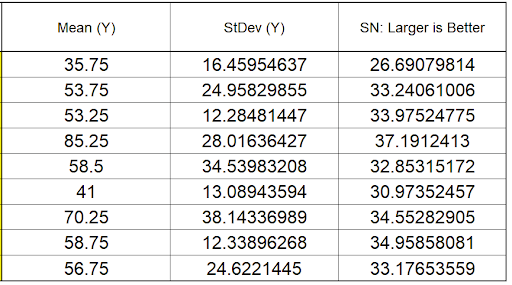
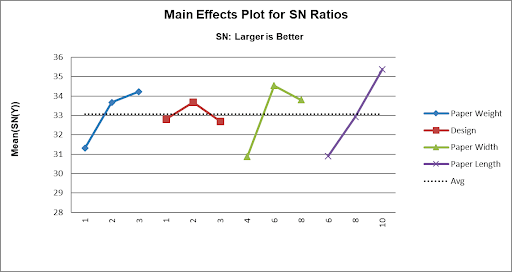
Since there are no interactions, we will focus our analysis on the Main Effects Plots for Signal-To-Noise Ratio and Mean Distance as done in the paper. Scroll right and down to view the Main Effects Plot for SN Ratios:
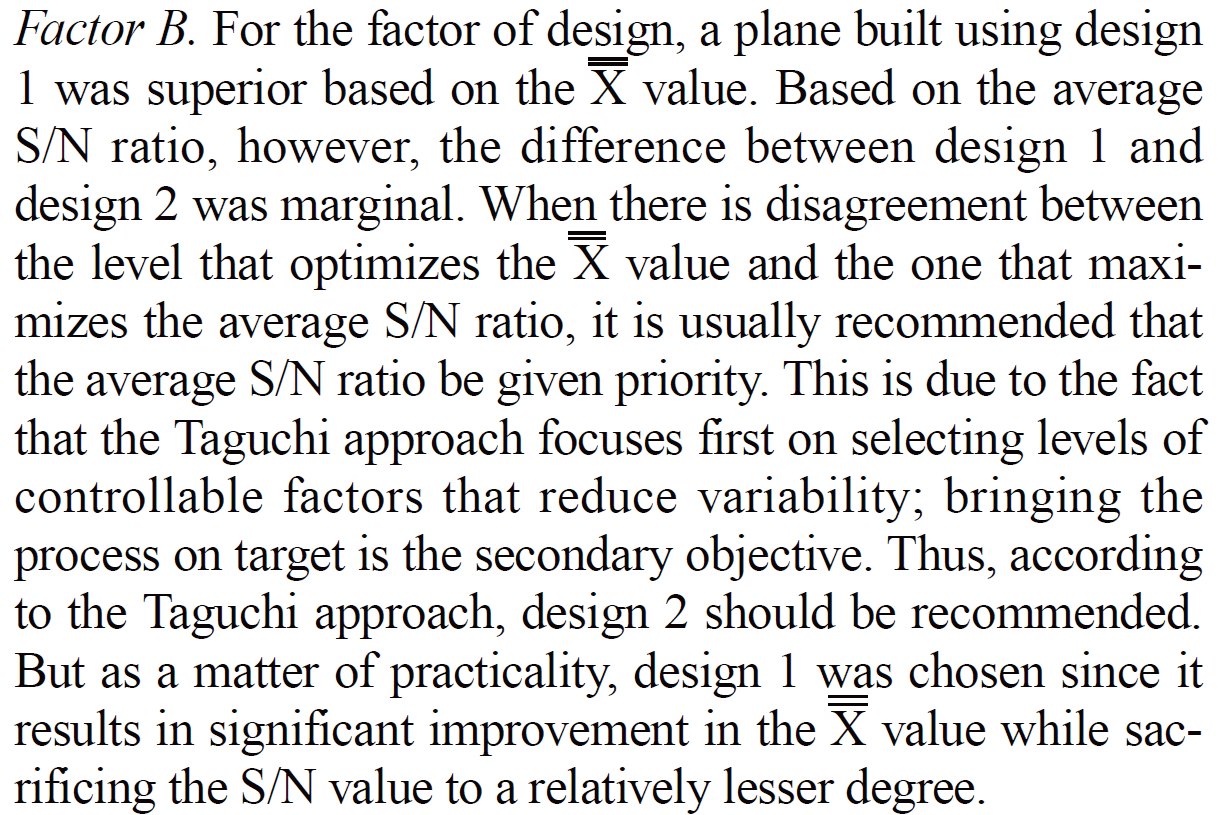
The optimum settings to maximize SN Ratio are: Paper Weight = 3, Design = 2, Paper Width = 6 and Paper Length = 10.
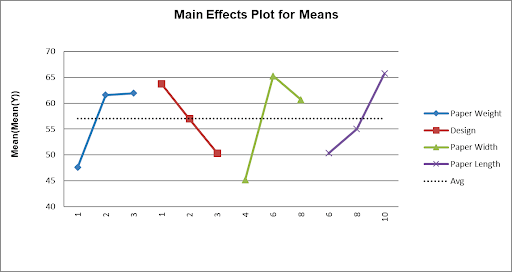
Scroll left to look at the Main Effects Plot for Means:
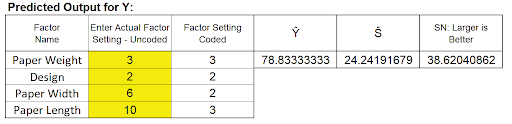
The optimum settings to maximize the Mean are: Paper Weight = 3, Design = 1, Paper Width = 6 and Paper Length = 10. (Note, The Y-Axis minimum has been adjusted to 40 to improve the scale).
Commenting on this difference, Sarin states:
We will compare the two settings using the Predicted Output Calculator. Scroll up and enter (or select from the drop-down list) as shown:
Now change the Design to 1 as shown:
As noted by the author, depending on the priority given to Mean or Signal-To-Noise Ratio, one would select Design 1 or 2. In either case, confirmation runs need to be performed to validate the experimental results.