How Do I Create Individuals Charts in Excel Using SigmaXL?
Individuals Charts
Open Customer Data.xlsx, click on Sheet 1. Click
SigmaXL > Control Charts > Individuals. Ensure that entire data table
is selected. If not, check
Use Entire Data Table. Click Next.
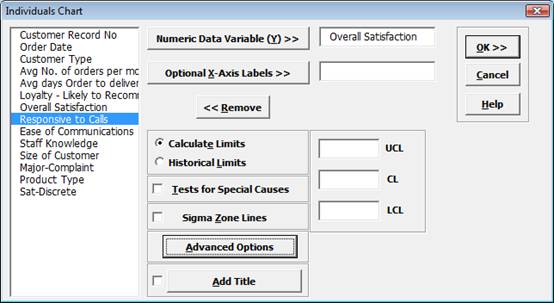
Select Overall Satisfaction, click
Numeric Data Variable (Y) >>. Ensure that Calculate
Limits is selected.
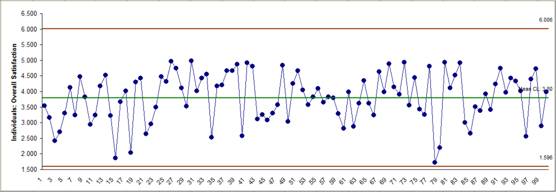
Click OK. Resulting Individuals control chart:
We have seen this data earlier as a run chart. The Control Chart
adds calculated control limits. Note that the Upper Control Limit exceeds the survey
upper limit of 5. Here it would be appropriate to change the UCL to 5.0. Click
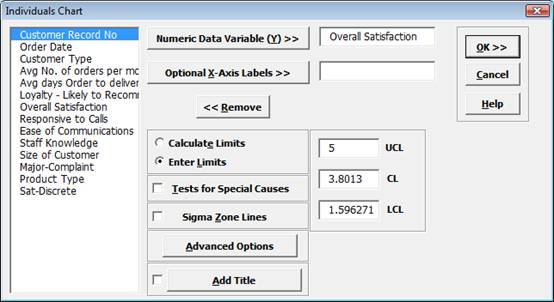
Recall SigmaXL Dialog menu or press F3 to recall last
dialog.
Select Overall Satisfaction, click Numeric Data
Variable (Y) >>, change
UCL to 5.
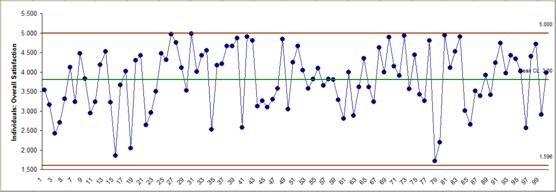
Click OK. Resulting Individuals chart with
modified UCL:
Tip: You should not change the calculated control limits unless you
have a legitimate reason such as a boundary condition. Do not replace the control limits
with specification limits the control chart will lose its statistical ability to
detect assignable causes. We will redo the Individuals chart for Overall Satisfaction
later using the Individuals Nonnormal tool.
Open
Delivery Times.xlsx. Click Sheet 1 Tab. This data set
contains room service delivery time deviations in minutes. The Critical Customer
Requirement is target time +/- 10 minutes.
Click SigmaXL > Control Charts >
Individuals. Ensure that entire data table is selected. If not, check Use
Entire Data Table. Click Next.
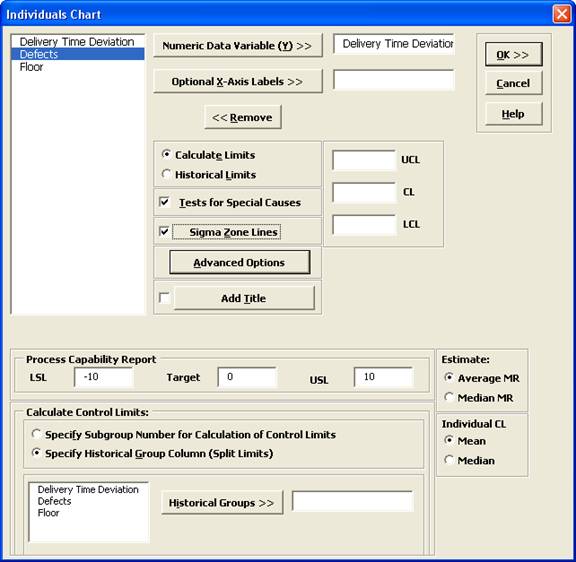
Select Delivery Time Deviation, click Numeric Data
Variable (Y) >>, check
Tests for Special Causes, check Sigma Zone Lines.
Ensure that Calculate Limits is selected.
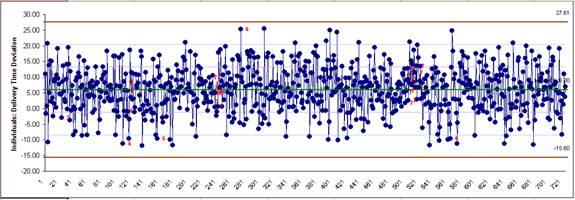
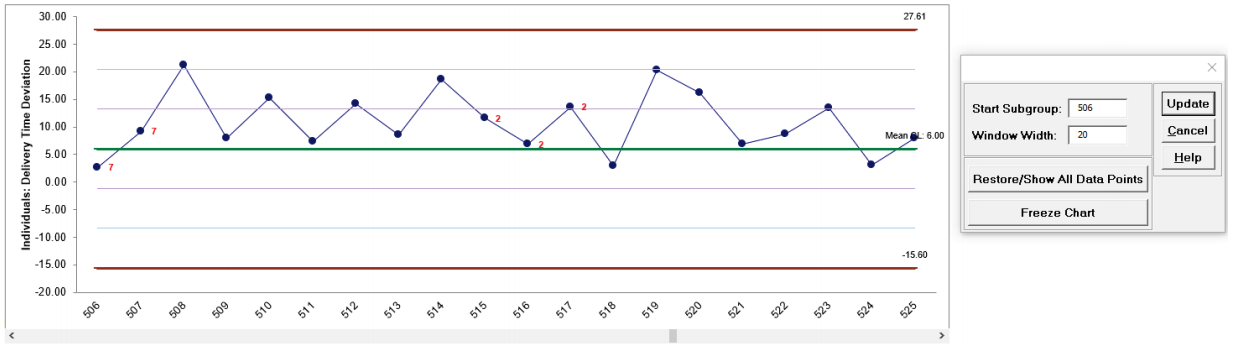
Some tests for special causes are indicated on the chart. If more than one test fails,
the number corresponds to the first failed test.
There are no points that exceed the +/- 3 sigma limits on this chart, but we see some
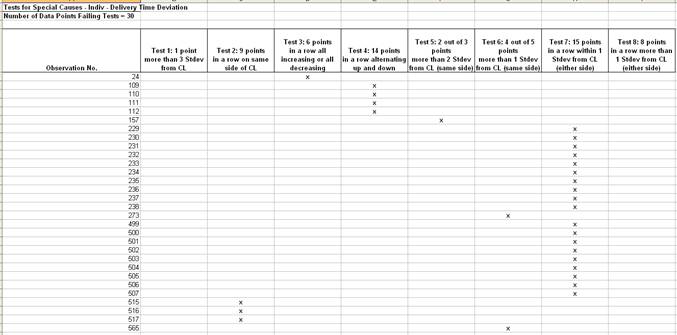
indication of instability with tests for special causes. The Tests for Special
Causes report below the chart provides detailed information about each
observation identified as a special cause. Note that the control chart also shows the
+/- 1 sigma and +/- 2 sigma lines to aid in viewing these tests.
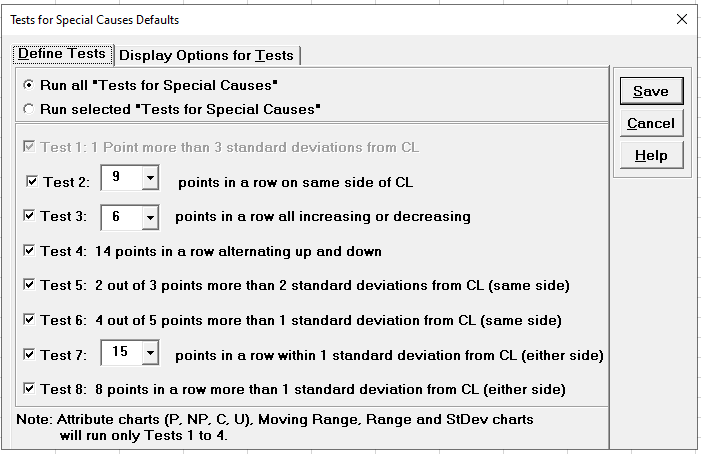
These tests for special causes can have defaults set to apply any
or all of Tests 1-8. Test 2 can be set to 7, 8, or 9 points in a row on same side of CL.
Test 3 can be set to 6 or 7 points in a row all increasing or decreasing. Test 7 can be
set to 14 or 15 points in a row within 1 standard deviation from CL. Click
Sheet 1 Tab. Click SigmaXL > Control Charts > Tests for
Special Causes Defaults to run selected tests for special causes:
Note that these defaults will apply to Individuals and X-bar charts. Test 1 to 4
settings will be applied to Attribute Charts.
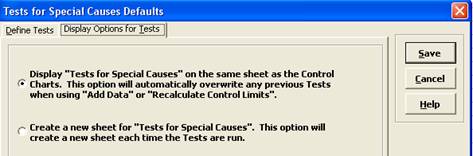
Click on the Tab Display Options for Tests.
If you prefer to create a separate worksheet for each Tests for Special
Causes report, choose Create a new sheet option. The
default is to display
Tests for Special Causes on the same sheet as the Control Chart. Note
that this report will be overwritten when you add data or recalculate control limits.
Click Save.
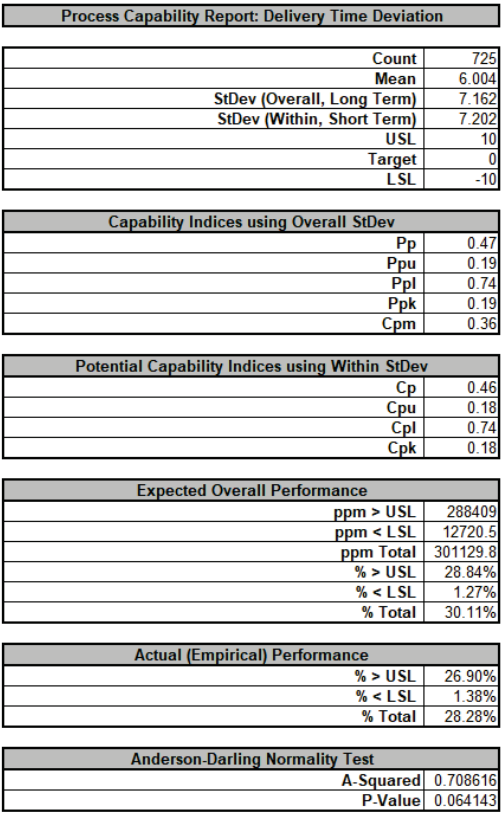
Click on Indiv Proc Cap Tab to view the Process Capability Report,
which includes potential (short term) capability indices Cp and Cpk:
While this process demonstrated some slight instability on the control charts, the
bigger issue was being late 6 minutes on average and having a Standard Deviation of 7.2
minutes! One improvement implemented was rescheduling the service elevators so that Room
Service and Maintenance were not both trying to use them during peak times.
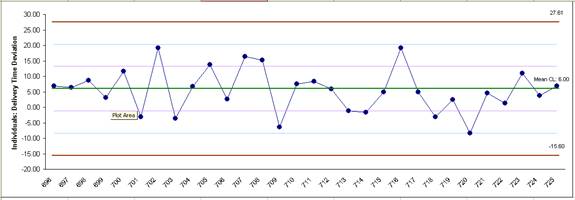
Click on the Indiv sheet. With 725 data points, you may want to have a
closer look at the most recent data. To do this, click
SigmaXL Chart Tools > Show Last 30 Points. (If this menu item does
not appear, click on any cell adjacent to the chart.) The resulting chart is shown:
To reset the chart, click SigmaXL Chart Tools > Show All Data
Points.
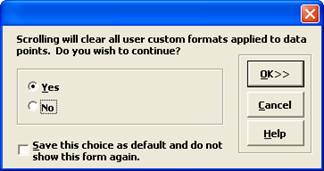
To enable scrolling, click SigmaXL Chart Tools > Enable Scrolling. A
warning message is given:
Scrolling will clear user custom formats, but does not affect Tests for Special
Causes.
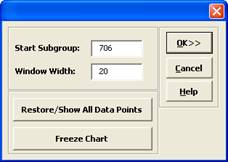
Click OK. A scroll dialog appears allowing you to specify the
Start Subgroup and Window Width:
At any point, you can click Restore/Show All Data Points or
Freeze Chart. Freezing the chart will remove the scroll and unload the
dialog. The scroll dialog will also unload if you change worksheets. To restore the
dialog, click SigmaXL Chart Tools > Enable Scrolling.
Click OK. The control chart appears with the scroll bar beneath it. You
can also change the Start Subgroup and Window Width
and Update.