X-Bar & R Charts
- Home /
- X-Bar & R Charts

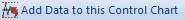
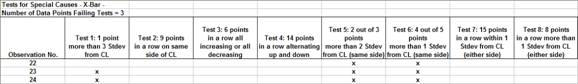
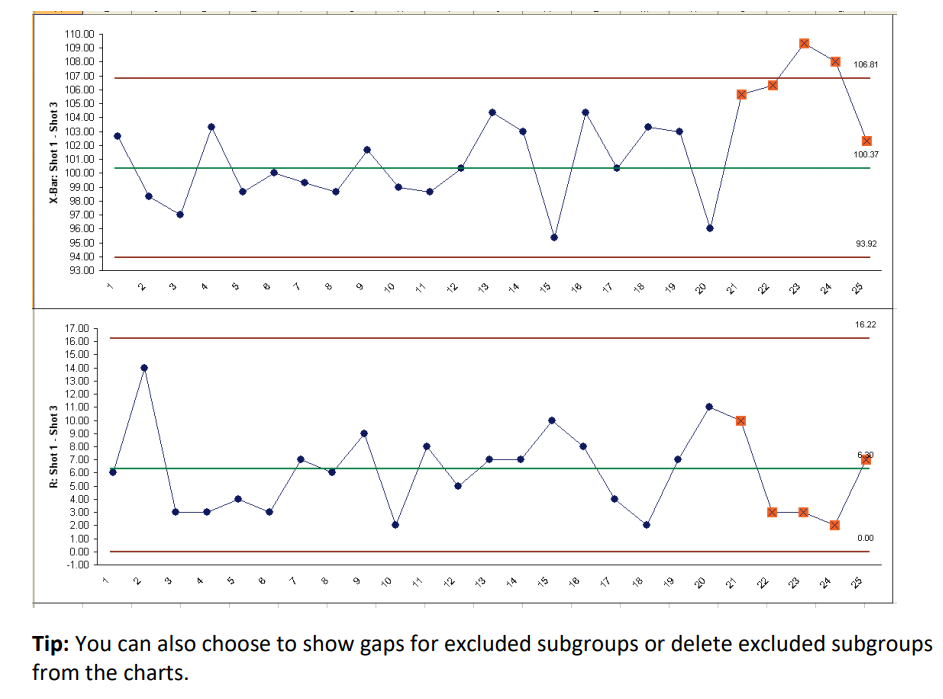
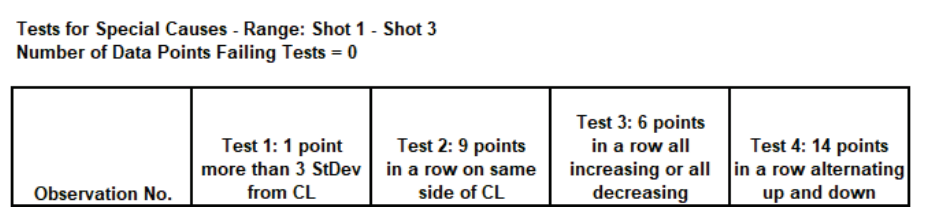
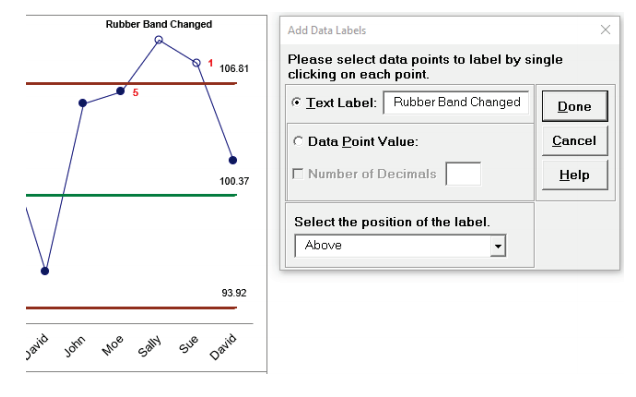
The X-bar chart and Tests for Special Causes report clearly shows that this process is now out of control with an unstable mean. The process must be stopped, and the Out-of-Control Action Plan must be followed to determine and fix the root cause. In this case, the assignable cause was a change of rubber band requiring a reset of the pull back angle. The use of tests for special causes gave us an early warning of this at observation number 22.
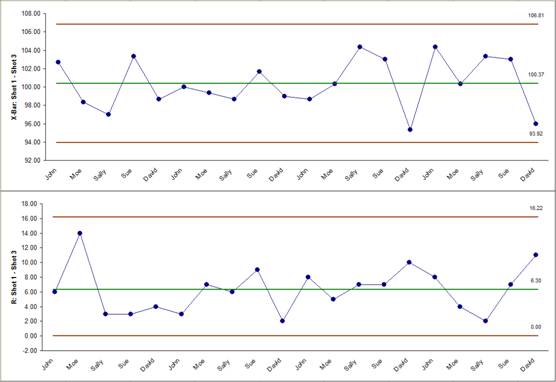
Note that the Range chart is in-control even though the X-Bar chart is out-of-control:
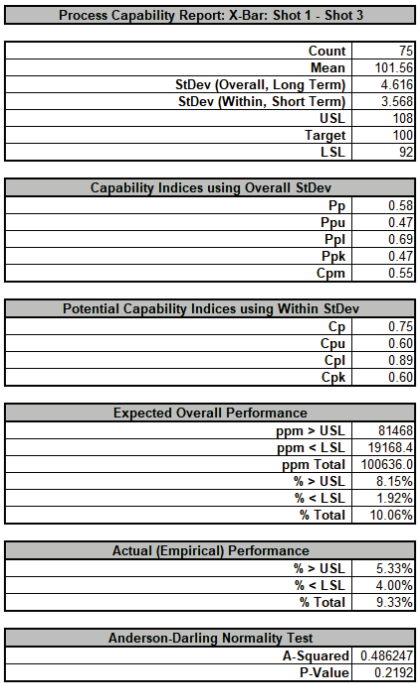
Note the difference between Pp and Cp; Ppk and Cpk. This is due to the process instability. If the process was stable, the actual performance indices Pp and Ppk would be closer to the Cp and Cpk values.
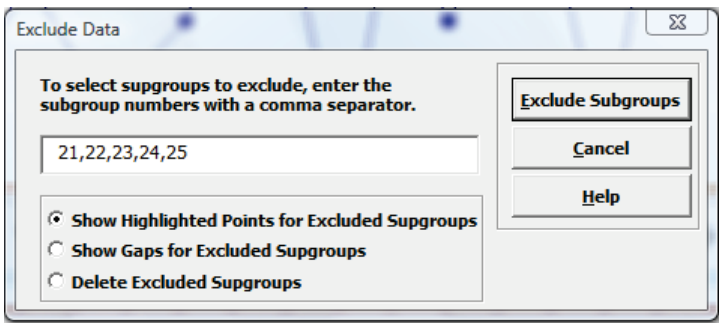
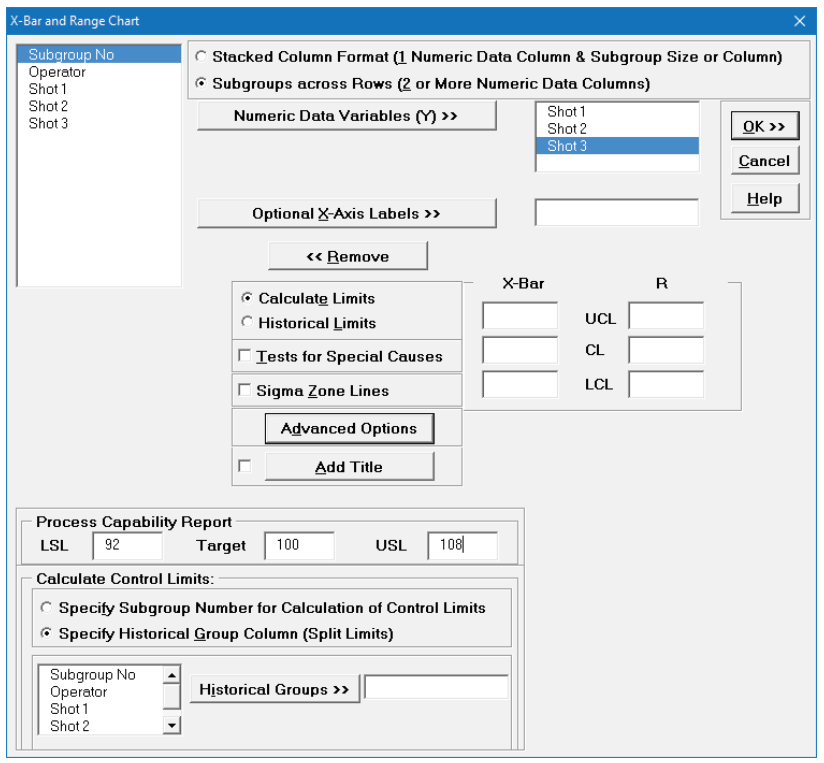
After creating a control chart, you can specify subgroups (or rows) to exclude by using the Exclude Data tool.
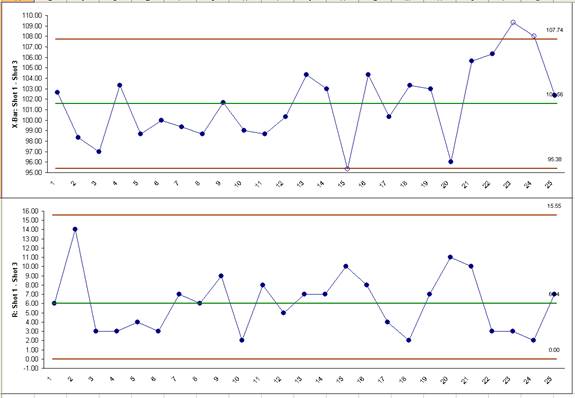
The control limits here were calculated including subgroups 21 to 25 which have a known assignable cause.