How Do I Perform ANOM Normal One-Way in Excel Using SigmaXL?
Open Customer Data.xlsx, click on Sheet 1 tab.
Click SigmaXL > Graphical Tools > Analysis of Means
(ANOM) > ANOM Normal One-Way.
Ensure that the entire data table is selected. If not, check Use Entire Data
Table.
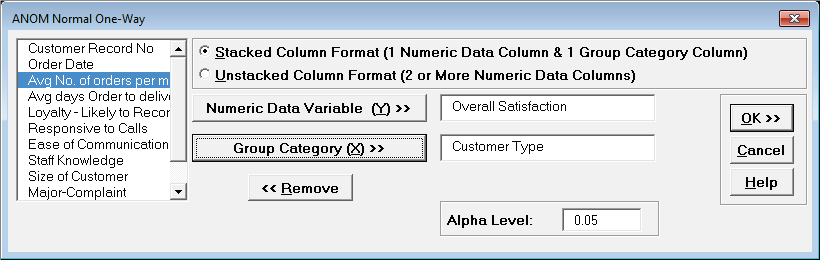
Click Next. Ensure that Stacked Column Format is
checked. Select Overall Satisfaction, click
Numeric Data Variable (Y) >>; select Customer Type, click Group
Category (X) >>. Set Alpha
Level = 0.05.
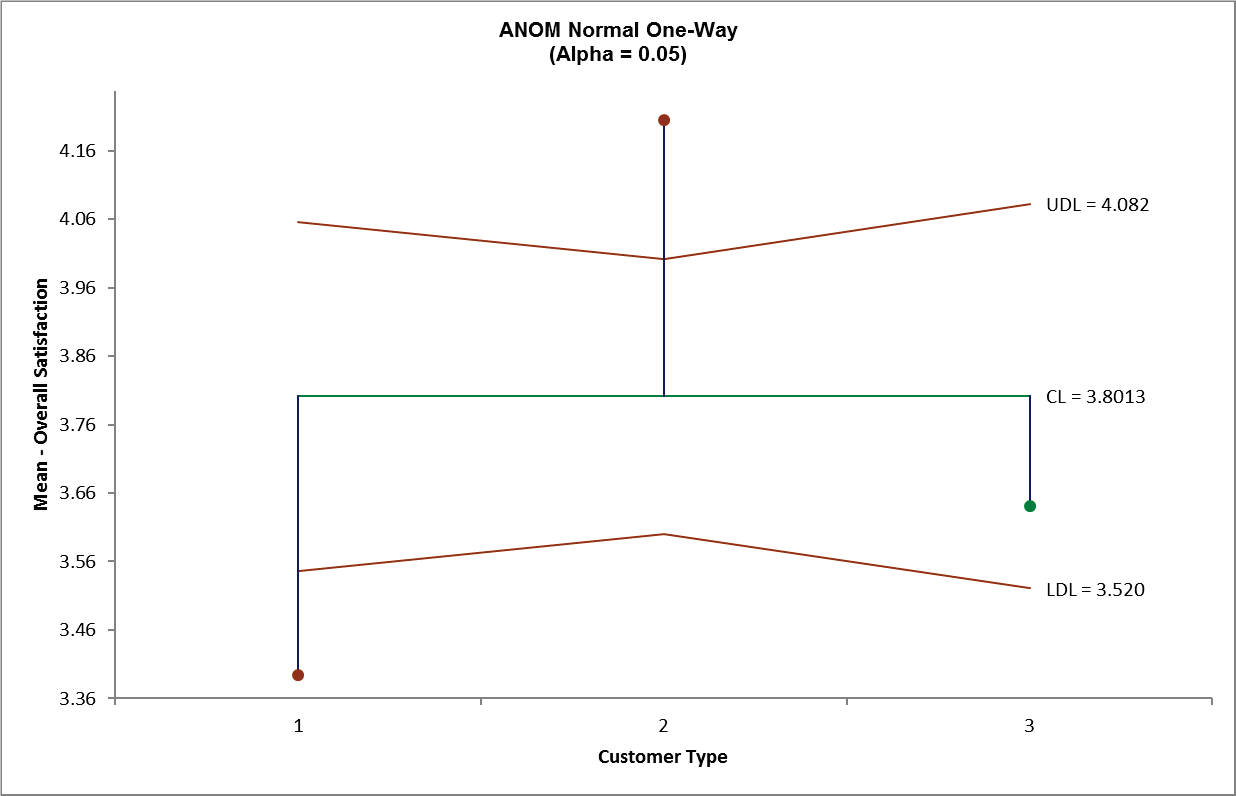
Click OK. The ANOM Normal One-Way chart is
shown below:
Here we see that Customer Type 1 mean satisfaction score is
significantly below the overall
mean and Customer Type 2 is significantly higher. This is
consistent with the results that were
observed in the ANOVA analysis, but is easier to interpret.
The varying decision limits are due to the varying sample sizes
for each Customer Type, with
smaller sample size giving wider limits in a manner similar to a
control chart. If the data are
balanced the decision limit lines will be constant.