How Do I Perform ANOM Poisson Rate One-Way in Excel Using SigmaXL?
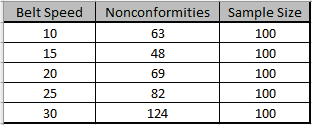
Open ANOM Examples.xlsx, click on the
Injection Molding-Poisson Rate tab. This is
injection
molding data for contact lenses. It is from a study on the
extent to which belt speed (cure time)
influences the incidence of nonconformities (such as bubbles and
tears) in the lenses. Since
there can be more than one nonconformity per unit, Poisson ANOM
is appropriate, similar to
the U Control Chart (Example 2.16 from the ANOM book used with
author permission).
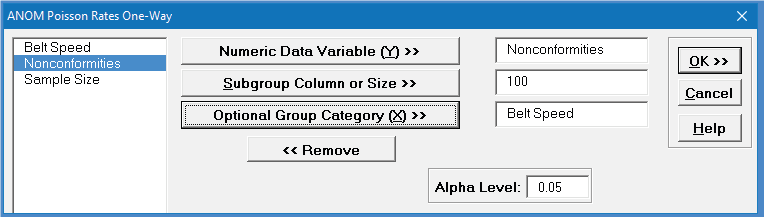
Click SigmaXL > Graphical Tools > Analysis of Means
(ANOM) > ANOM Poisson Rates One-Way. Ensure that the entire data table
is selected. If not, check
Use Entire
Data Table.
Click Next. Select Nonconformities,
click Numeric Data Variable (Y) >>; enter 100 (or select
Sample Size) for Subgroup Column or Size >>; select
Belt Speed,
click Optional Group Category
(X) >>. Set Alpha Level = 0.05:
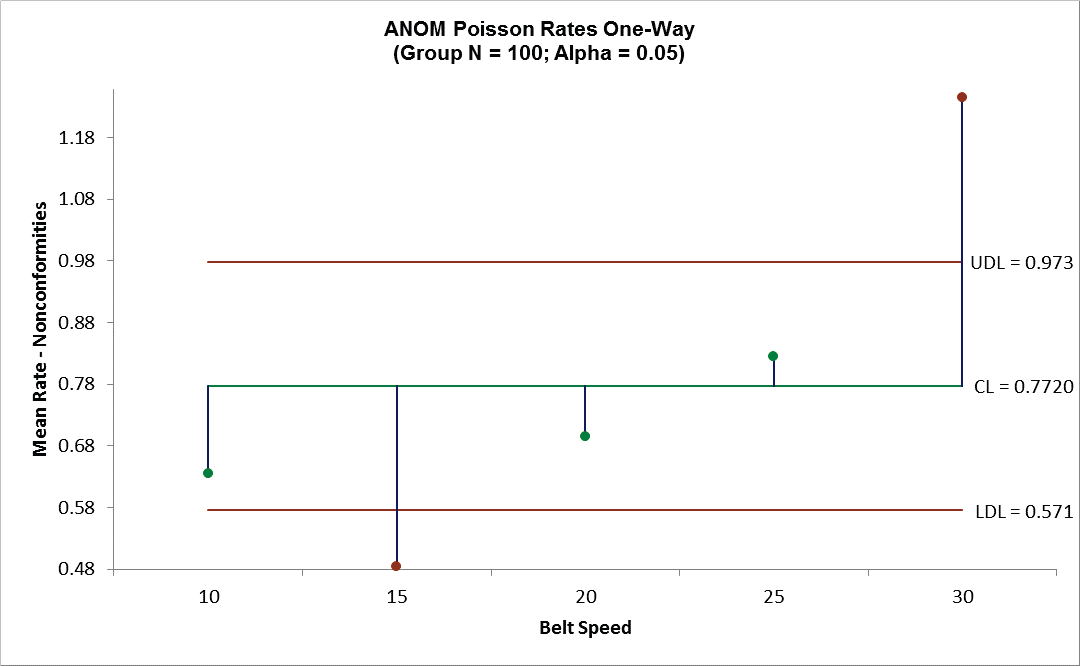
Click OK. The ANOM Poisson Rates One-Way
chart is shown below:
From the ANOM chart, one sees that a belt speed of 15 results in
a significantly low number of
nonconformities and a belt speed of 30 results in a
significantly high number of
nonconformities.