Basic Statistical Templates – 2 Poisson Rates Test and Confidence Interval
Example
Click SigmaXL > Templates & Calculators > Basic
Statistical Templates > 2 Poisson Rates Test and Confidence Interval to
access the
template.
Notes
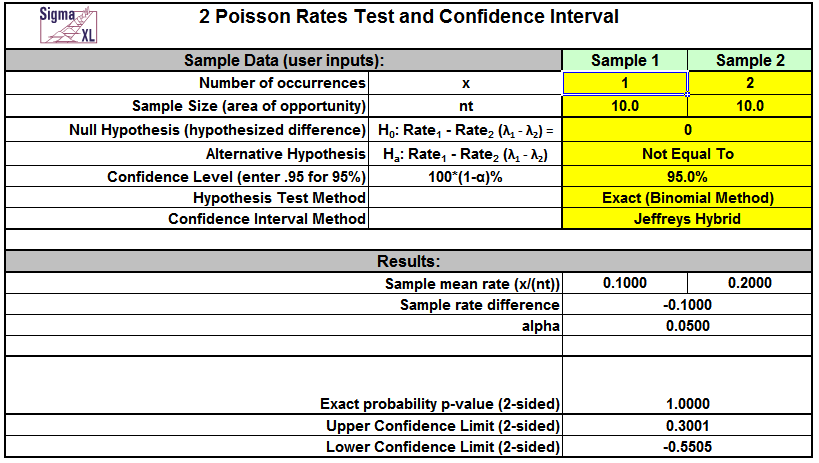
- Enter summarized Sample Data, Null Hypothesis and Confidence Level in cells with
yellow highlight. Do not modify any other part of this worksheet.
- Sample Size (area of opportunity) can be a count, time, length or other unit that
defines the area of opportunity for an occurrence.
- Select Alternative Hypothesis and Methods using drop-down.
- Hypothesis Test Method:
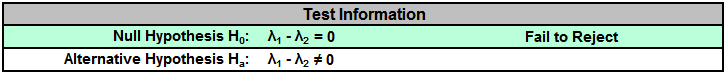
- Exact (Binomial Method) is recommended, but is only valid for H0: λ1 - λ2 = 0.
- Use Normal Approximation only when the number of occurrences for each sample is
greater than 10. Unpooled is used if H0: λ1 - λ2 <> 0. Use pooled if H0:
λ1 - λ2 = 0.
- Confidence Interval Method:
- Confidence intervals for difference in Poisson rates have an "oscillation"
phenomenon where the coverage probability varies with x and n.
- Jeffreys Hybrid is recommended and has a mean coverage probability that is close
to the specified confidence interval. (See Li, 2011).
- Normal Approximation is not recommended, but included here to validate hand
calculations. Use only when the number of occurrences for each sample is greater
than 10.
- Due to the complexity of calculations, this template uses vba macros rather than
Excel formulas. SigmaXL must be initialized and appear on the menu in order for this
template to function.
References:
Li, H.Q., Tang, M.L., Poon, W.Y. and Tang, N.S. (2011), Confidence intervals for
difference between two Poisson rates, Comm. Stat. Simul. Comput. 40, pp. 1478–1491.
Przyborowski, J., Wilenski, H., (1940), Homogeneity of results in testing samples from
Poisson series. Biometrika 31, 313–323.


