How Do I Perform a Box-Cox Transformation in Excel Using SigmaXL?
Box-Cox Transformation
This is a standalone tool that allows you to visually see how the Box-Cox transformation selects a rounded or optimal lambda value.
- Open the file Nonnormal Cycle Time2.xlsx. Select Sheet 1 Tab.
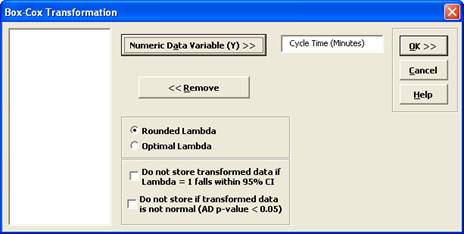
- Click SigmaXL > Process Capability > Nonnormal > Box-Cox Transformation (or SigmaXL > Data Manipulation > Box-Cox Transformation or SigmaXL > Control Charts > Nonnormal > Box-Cox Transformation). Ensure that the entire data table is selected. If not, check Use Entire Data Table. Click Next.
- Select Cycle Time (Minutes), click Numeric Data Variable (Y) >>. The selected variable must contain all positive values.
Tip: Note that while this tool is often successful to transform the data to normality, there may not be a suitable transformation to make the data normal. The output report indicates the Anderson-Darling p-value for the transformed data. You may wish to check Do not store if transformed data is not normal . Another option is Do not store transformed data if Lambda = 1 falls within 95% CI. This latter option prevents you from using transformations that do not result in a statistically significant improvement towards normality.
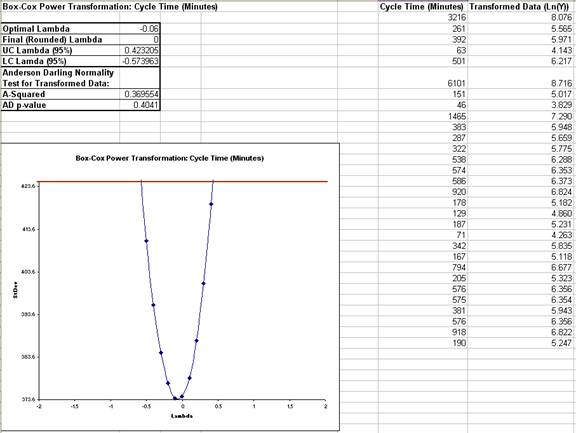
- Click OK. The resulting report is shown:
- The fact that Lambda=1 falls outside of the 95% confidence interval tells us that the transformation is statistically significant. The Anderson-Darling p-value of 0.4041 indicates that we cannot reject the null hypothesis that the transformed data is normal, so the Ln transformation has successfully converted the data to normality.