Utilities Lag Data
The Lag Data utility is a useful utility to create Lag (or Lead) columns of data. This was
demonstrated previously in the section Autocorrelation (ACF/PACF) Plots.
- Open Chemical Process Concentration Series A.xlsx (Sheet 1 tab).
This is the Series A data from Box and Jenkins, a set of 197
concentration values from a chemical process taken at two-hour
intervals.
- Click
SigmaXL > Time Series Forecasting > Utilities > Lag Data.
Ensure that the entire data table is selected. If not, Use Entire Data
Table. Click Next.
-
Click Concentration, click Numeric Time
Series Data (Y) >>.
Use the default Number of Lags = 1.
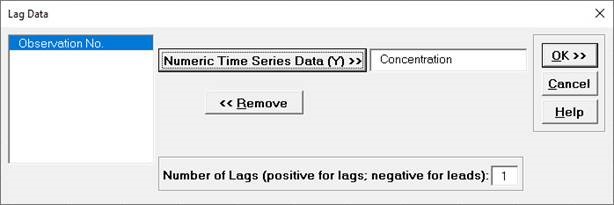
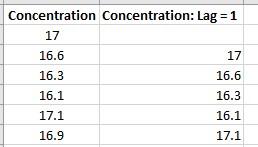
- Click OK. A new sheet is created with the Lag 1
data.
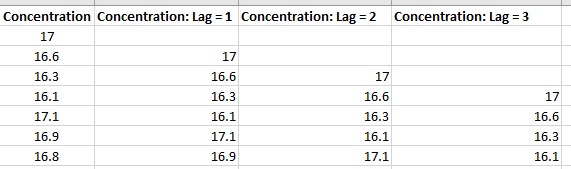
- Click Recall SigmaXL Dialog
menu or press F3 to Recall Last Dialog. Enter
Lag = 2. Click OK. Repeat for
Lag = 3. The Lag columns are appended as shown: