The Nonparametric Runs test does not
assume that the sample data are normally distributed, but it does
assume that the test statistic follows a Normal distribution when
computing the large sample or asymptotic P-Value. With a small
sample size (N <= 50), this approximation may be invalid, so exact
methods should be used. SigmaXL computes the exact P-Values
utilizing permutations.
It is important to note that while exact P-Values are correct,
they do not increase (or decrease) the power of a small sample test,
so they are not a solution to the problem of failure to detect a
trend due to inadequate sample size.
Clustering, Mixtures and Lack of
Randomness (Runs Above/Below)
If Count (N) is greater than 1000, the exact P-Value
is estimated using a continuity-corrected normal approximation.
Since the Runs Test Exact P-Value is computed very quickly for
sample sizes as large as 1000, Monte Carlo P-Values are not
required.
Trends and Oscillation (Runs
Up/Down)
Exact P-Values are derived from published tables,
given the sample size and the number of up/down runs. The exact
tables apply to N <= 50. If N > 50, a continuity-corrected normal
approximation is used.
We will now redo the Customer Data Overall Satisfaction example to
compute exact P-Values. Typically this would not be necessary unless
the sample sizes were smaller (N <= 50), but this gives us
continuity on the example. We will also consider the above small
sample examples later.
Open Customer Data.xlsx, click Sheet 1
tab.
Click SigmaXL > Statistical Tools >
Nonparametric Tests Exact > Runs Test Exact. If necessary, check
Use Entire Data Table, click Next.
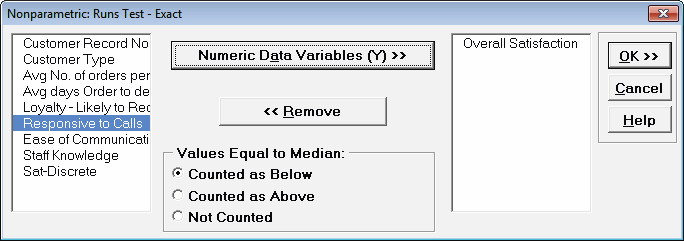
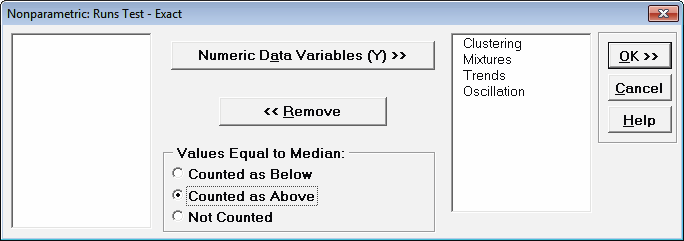
Select Overall Satisfaction,
click Numeric Data Variables (Y) >>. Set
Values Equal to Median: to Counted as
Below.
Note on Options for
Clustering, Mixtures and Lack of Randomness (Runs Above/Below)
If none of the observations are equal to the sample median, the
options for Values Equal to Median: do not
affect the exact P-Value. That is the case with this Customer
Data example. In cases where there are observations equal to the
sample median, then the exact P-Value will be different for each
option selected. For regular Runs Test, SigmaXL uses
Counted as Below (in agreement with Minitab). StatXact
uses Counted as Above for the Runs Test. Matlab
uses Not Counted. Users should try Counted
as Below and Counted as Above to
ensure that the P-Values agree on reject or fail to reject H0.
Note on Options for Trends
and Oscillation (Runs Up/Down)
The Values Equal to Median options also apply
to the Runs Up/Down Test: zeros of the first order differences
(i.e., two consecutive values that are the same).
Counted as Below denotes counted as negative.
Counted as Above denotes counted as positive.
Not Counted denotes that zero first order differences
are deleted. This consolidation of options was done to keep the
dialog simple.
Missing values are ignored for all exact runs tests.
Use of these options will be demonstrated in the small sample
example.
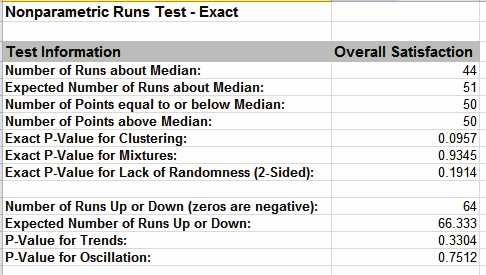
Click OK. Resulting
Output:
With all of the P-Values being greater than 0.01 (alpha = .01 is
preferred for the Runs Test to minimize false alarms), we fail
to reject H0, and conclude that the data is random (or
statistically independent).
The Above/Below and Up/Down Runs counts are identical to the
above large sample or asymptotic results. The
Clustering/Mixtures/Randomness (Above/Below) Exact P-Values are
close but slightly different. This was expected because the
sample size is reasonable (N > 50), so the large sample
P-Values are valid using a normal approximation.
The P-Values for Trends and Oscillation (Up/Down) use a normal
approximation because the sample size is greater than 50. They
are, however, slightly different than the large sample above
because a continuity correction is now applied to the normal
approximation.
Now we will consider
the small sample examples. Open Runs Test Example
Data.xlsx, click Runs Test Example Data
tab.
Click SigmaXL > Statistical
Tools > Nonparametric Tests Exact > Runs Test Exact.
If necessary, check Use Entire Data Table,
click Next.
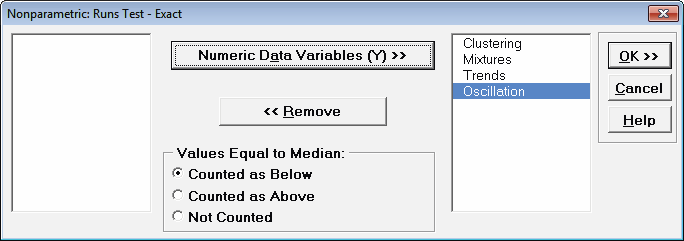
Select
Clustering and shift click to Oscillation, click
Numeric Data Variables (Y) >>. Set
Values Equal to Median: to Counted as Below.
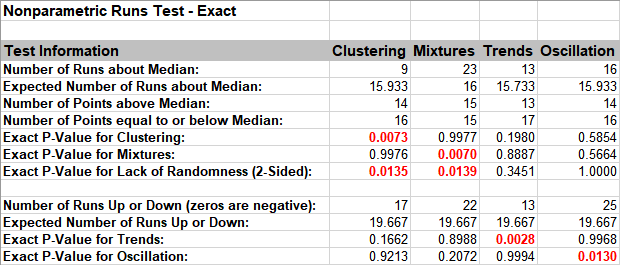
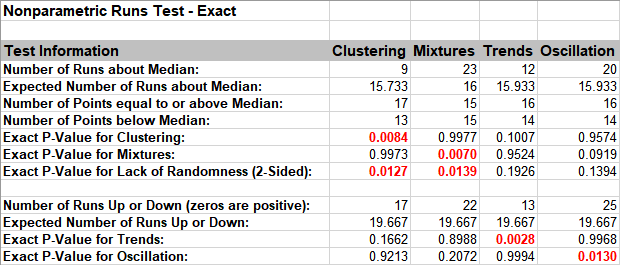
Click OK. Resulting output:
The Exact P-Values are close to the above large sample or
asymptotic results, but note that some of the values are now
greater than .01 so they would fail-to reject H0. Note that this
does not imply that the large sample runs test is more powerful,
but rather we cannot conclude some of the previously identified
patterns at the 99% confidence level.
We will now rerun the analysis using the Counted as
Above option.
Press F3 or click Recall SigmaXL Dialog
to Recall Last Dialog. Set Values Equal to Median:
to Counted as Above.
Click OK. Results:
Note the change in Trends and
Oscillation Number of Runs and resulting dramatic
change to the Exact P-Values.
In conclusion, when using Runs Test Exact, always try
Counted As Below and Counted as Above
to ensure that the P-Values agree with each other. Also,
whenever you have a small sample size and are performing a
Nonparametric test, always use Exact.