Basic MSA Templates - Gage Bias and Linearity Study
Click SigmaXL > Templates & Calculators > Basic MSA
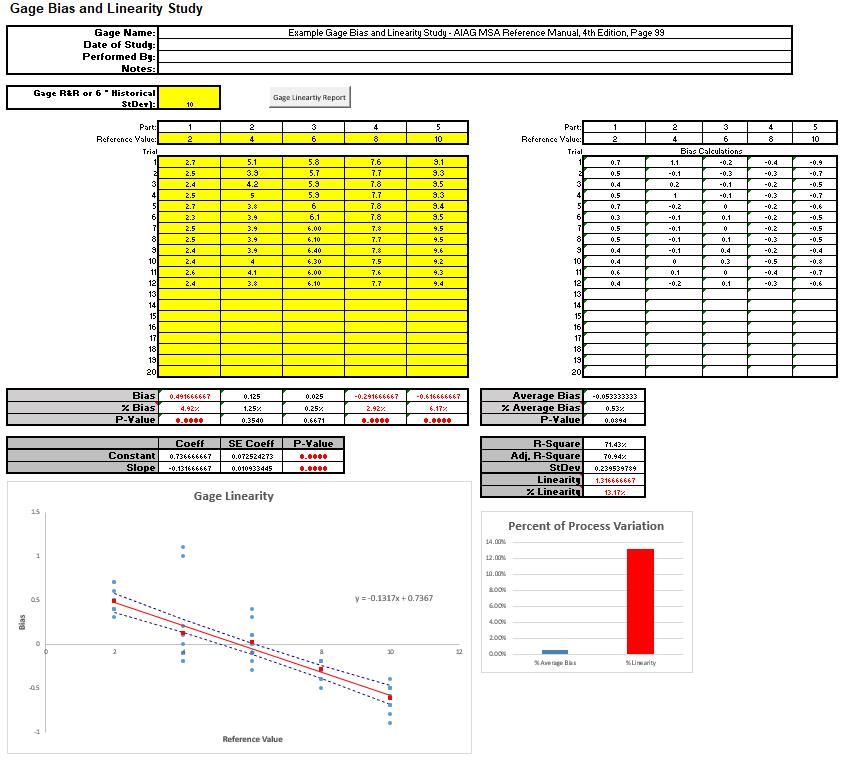
Templates > Gage Bias and Linearity Study
to access the Gage Bias and Linearity Study template.
The following example is given in SigmaXL > Help >
Template Examples > MSA > Gage Bias and Linearity Study.
Notes:
Enter Process Variation (SV from Gage R&R or 6 * Historical
StDev). If neither are available, use Process Tolerance. %
Average Bias will be blank if not specified. Note that %
Linearity does not require Process Variation
Enter part Reference Values. These should be relative to
a traceable standard, but if not available, see AIAG MSA
Reference Manual [1], pp. 92-93 for suggestions on how to
obtain reference values. Reference values should cover the
operating range of the gage.
Enter part measurement data in the yellow highlight region
below the respective part/reference value. AIAG recommends a
minimum of 10 trials per part/reference. It is important that
the parts be selected at random for each trial in order to
minimize appraiser "recall" bias.
Click Gage Linearity Report button to generate the
Linearity Report.
If a P-Value is < .05, it is highlighted in bold red to
indicate significance. If the Average Bias PValue or Linearity
Slope P-Value are < .05, the respective bar in Percent of
Process Variation will also be red to highlight significance.
Statistical significance is the best indicator of a problem
with bias or linearity. Some practitioners also use a rule of
thumb that a good measurement system will have % Average Bias <
5% and % Linearity < 5%.
The dashed lines on the Linearity scatter plot are the
regression fit 95% confidence intervals. If the zero reference
line is not within the intervals, the linearity slope is
significant, indicating that the measurement system linearity is
not acceptable.
This calculator requires Excel 2013 or higher. Linearity
regression uses vba macros rather than Excel formulas. SigmaXL
must be initialized and appear on the menu in order for this
template to function.
Rows 34-39 and 42 are hidden to simplify the output report.
These may be unhidden to view how the calculations are
performed.