Basic Statistical Templates - 1 Proportion Test and Confidence Interval Example
Click Click SigmaXL > Templates & Calculators > Basic Statistical Templates > 1 Proportion Test and Confidence Interval to access the template.

Notes
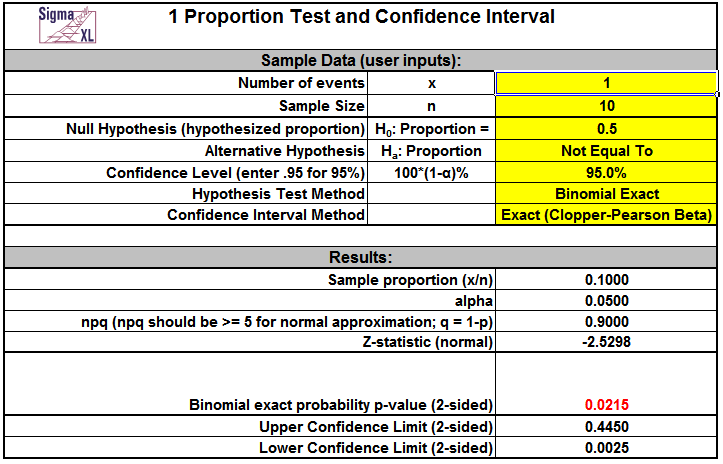
- Enter summarized Sample Data, Null Hypothesis and Confidence Level in cells with yellow highlight. Do not modify any other part of this worksheet.
- Select Alternative Hypothesis and Methods using drop-down. If x = 0, it is recommended that the Alternative Hypothesis be set to one-sided "Less Than." If x = n, set the Alternative Hypothesis to one-sided "Greater Than."
- Hypothesis Test Method:
- Binomial Exact is recommended.
- Use Normal Approximation only when n is large and proportion is close to 0.5 (check that np >= 5 and nq >= 5, or the more conservative npq, shown above, >= 5). See Rosner (2010).
- Confidence Interval Method (recommendations based on literature review, see references below):
- Confidence intervals for binomial proportions have an "oscillation" phenomenon where the coverage probability varies with n and p.
- Exact (Clopper-Pearson) is strictly conservative and will guarantee the specified confidence level as a minimum coverage probability, but results in wide intervals. Recommended only for applications requiring strictly conservative intervals.
- Wilson Score and Jeffreys Beta have mean coverage probability matching the specified confidence interval. We recommend Wilson for two-sided confidence intervals and Jeffreys for one-sided.
- Normal Approximation (Wald) is not recommended, but included here to validate hand calculations. Use only when n is large and proportion is close to 0.5 (check that npq, shown above, >= 5).
- Confidence Interval Method (recommendations based on literature review, see
references below):
- Confidence intervals for binomial proportions have an "oscillation" phenomenon where the coverage probability varies with n and p.
- Exact (Garwood Chi-Square) is strictly conservative and will guarantee the
specified confidence level as a minimum coverage probability, but results in
wide intervals. Recommended only for applications requiring strictly
conservative intervals.
- Jeffreys has mean coverage probability matching the specified confidence
interval and is recommended.
- Normal Approximation (Wald) is not recommended, but included here to validate
hand calculations. Use only when the number of occurrences, x > 10.
- This calculator will automatically detect the version of Excel and use the appropriate statistical functions.
References:
Agresti, A. and Coull, B.A.(1998), Approximate is Better than "Exact" for Interval Estimation of Binomial Proportions. The American Statistician,52,119—126.
Brown, L. D., Cai, T. T. and DasGupta, A. (2001), Interval estimation for a binomial proportion. Statistical Science, 16, 101-133. With comments and a rejoinder by the authors.
Cai, T. T. (2005), One-sided confidence intervals in discrete distributions. J. Statist. Plann. Inference,131, 63-88.
Clopper, C.J.,and Pearson, E.S.(1934), The Use of Confidence or Fiducial Limits Illustrated in the Case of the Binomial. Biometrika, 26, 404—413.
Newcombe, R. (1998a), Two-sided confidence intervals for the single proportion: Comparison of seven methods, Statistics in Medicine,17, 857—872.
Rosner, B. (2010), Fundamentals of Biostatistics. Seventh Edition. Equation 5.15, page 133. Duxbury Press.
Vollset, S.E. (1993). Confidence intervals for a binomial proportion, Statistics in Medicine, 12, 809—824.


