How Do I Create Individuals & Moving Range Charts in Excel Using SigmaXL?
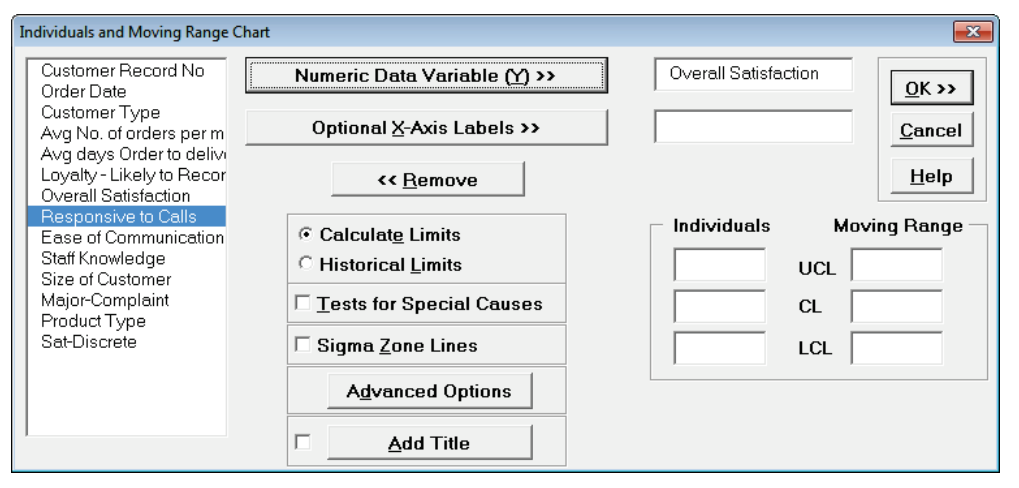
Open Customer Data.xlsx, click on Sheet 1. Click SigmaXL > Control Charts > Individuals & Moving Range. Ensure that the entire data table is selected.
If not, check Use Entire Data Table. Click Next.
Select Overall Satisfaction, and click Numeric Data Variable (Y) >>. Ensure that Calculate Limits is selected.
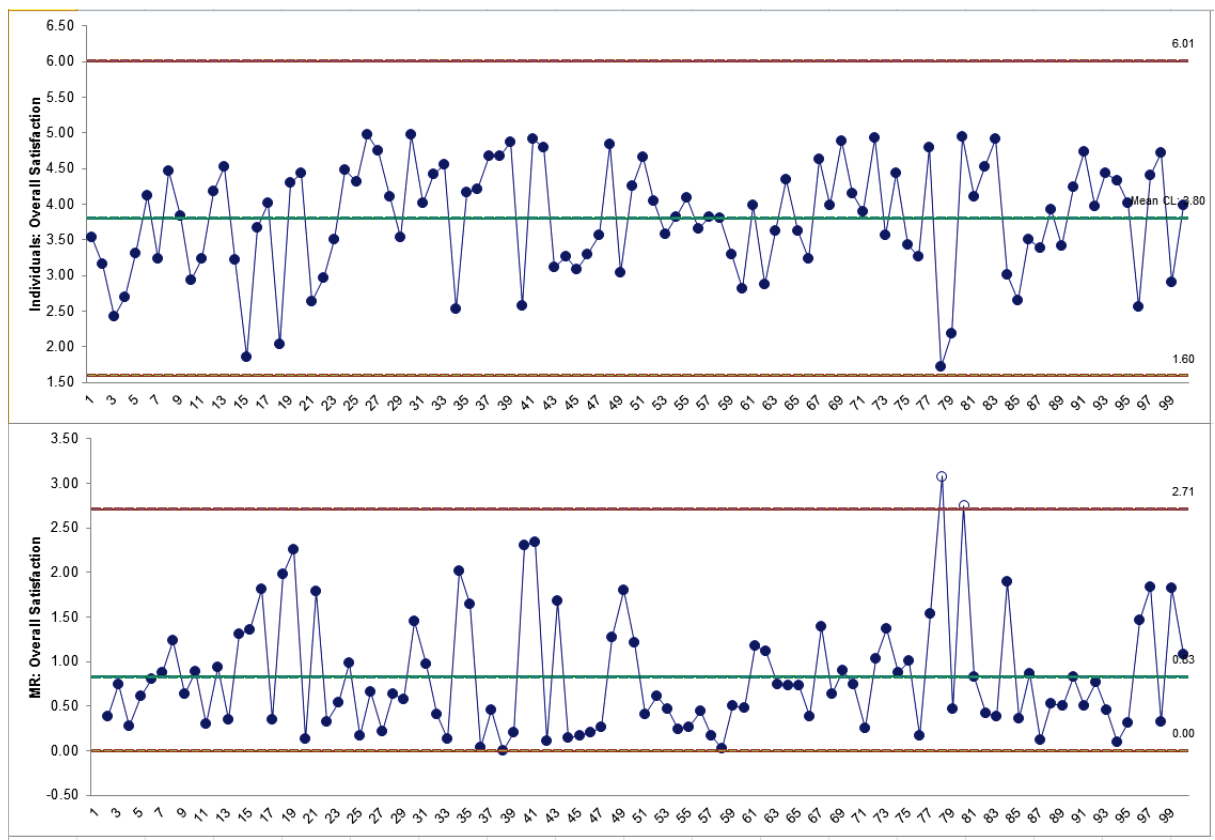
Click OK. The resulting Individuals & Moving Range control chart: