Kruskal-Wallis — Exact
This tool is used to estimate the exact P-Value using Monte Carlo. Typically this would not
be necessary unless the sample sizes were smaller (each sample N <= 5 for Kruskal-Wallis),
but this gives continuity on the example.
Computing an exact P-Value for Kruskal-Wallis is very computationally intensive. The
Network Model by Mehta and Patel cannot be used for this test (see Appendix Exact and Monte Carlo P-Values for Nonparametric and Contingency Tests). In this example,
the total number of permutations are:
(31+42+27)! / (31! * 42! * 27!) = 7.42 E44
(i.e., more than the number of stars in the observable universe). So we will not
attempt to compute the exact, but rather use Monte Carlo.
- Open Customer Data.xlsx, click on Sheet 1 tab
(or press
F4 to activate last worksheet).
- Click SigmaXL > Statistical Tools >
Nonparametric Tests - Exact > Kruskal-Wallis - Exact.
If necessary, check Use Entire Data Table, click
Next.
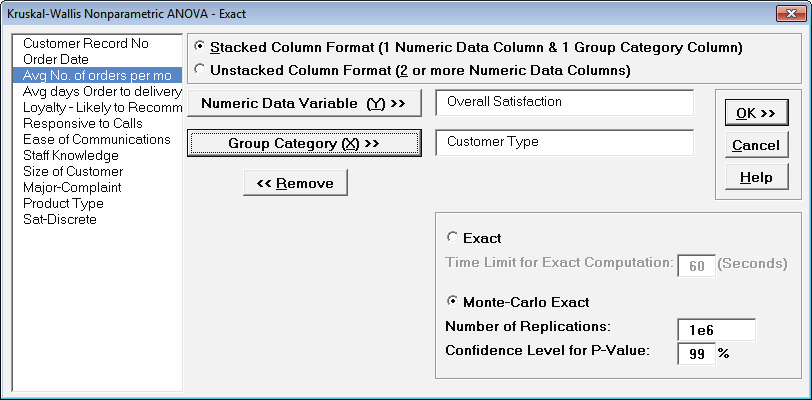
- Ensure that Stacked Column Format is
checked. Select Overall Satisfaction, click Numeric Data
Variable (Y) >>; select Customer Type, click
Group Category (X) >>.
Select Monte Carlo Exact with the Number of
Replications = 1e6 and Confidence Level for
P-Value = 99%. One million replications are used because the
expected P-Value is very small as estimated from the large sample
Kruskal-Wallis above. This will take up to a minute to run, so if you have a
slow computer, use 1e5 replications instead of 1e6.
Tip: The Monte Carlo 99% confidence interval
for P-Value is not the same as a confidence
interval on the test statistic due to data sampling error.
The confidence level for the hypothesis test statistic is still 95%, so
all reported P-Values less than .05 will be
highlighted in red to indicate significance. The 99% Monte Carlo
P-Value confidence interval is due to the uncertainty in Monte Carlo sampling,
and it becomes smaller as
the number of replications increases (irrespective of the data sample size). The
Exact P-Value will lie within the stated Monte Carlo confidence interval 99% of
the time.
- Click OK.
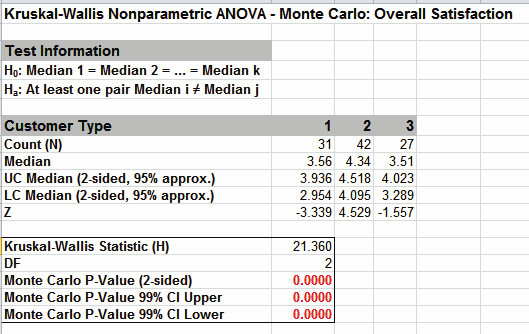
Click on cell B16 to view the P-Value with more decimal place
precision (or change the cell format to scientific notation).
The Monte Carlo P-Value here is 0.000009 (9 e-6) with a 99%
confidence interval of .000002 (2 e-6) to 0.000016 (1.6 e-5).
This will be slightly different every time it is run (the Monte
Carlo seed value is derived from the system clock). So we reject
H0: at least one pairwise set of medians are not equal.
Note that the large sample (asymptotic) P-Value of 2.3 e-5 lies
outside of the Monte Carlo exact confidence interval.
-
Now we will consider a small sample problem. Open Snore
Study.xlsx. This data is from:
Gibbons, J.D. and Chakraborti, S. (2010). Nonparametric
Statistical Inference (5th Edition). New York: Chapman & Hall,
(Example 10.2.1 data, page 347; Example 10.4.2 analysis, pp. 360
362).
An experiment was conducted to determine which device is the
most effective in stopping snoring or at least in reducing it.
Fifteen men who are habitual snorers were divided randomly into
three groups to test the devices. Each mans sleep was monitored
for one night by a machine that measures the amount of snoring on a
100-point scale while using a device.
- Select Snore Study Data
tab. Click SigmaXL > Statistical Tools > Nonparametric
Tests Exact > Kruskal-Wallis - Exact.
If necessary, check Use Entire Data Table, click
Next.
- With Unstacked Column Format checked,
select Device A, Device B and Device C, click Numeric Data
Variables (Y) >>.
Select Exact with the default Time Limit for Exact
Computation = 60 seconds.
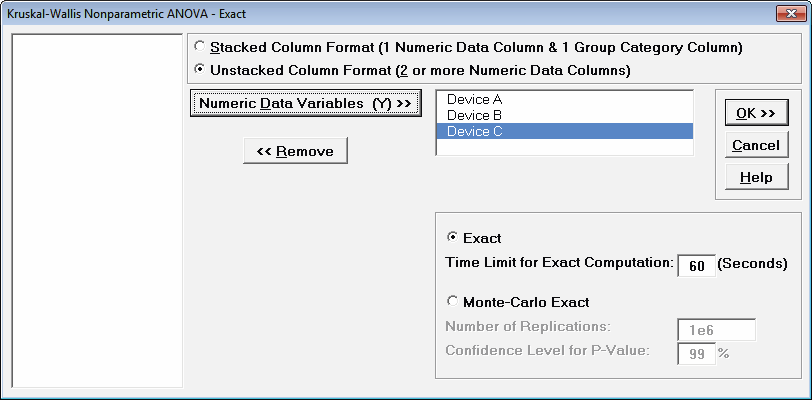
- Click OK. Results:
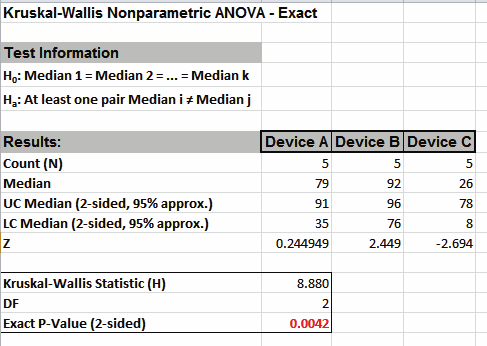
With the Exact P-Value = 0.0042 we reject H0, and conclude that
there is a significant difference in median snore study scores.
This exact P-Value matches that given in the reference textbook
using SAS and StatXact.
By way of comparison, we will now rerun the analysis using the
large sample or asymptotic Kruskal-Wallis test.
- Select Snore Study Data
tab (or press F4 to activate last worksheet).
Click SigmaXL > Statistical Tools > Nonparametric Tests
> Kruskal-Wallis. If necessary, check Use
Entire Data Table, click Next.
- With Unstacked Column Format
checked, select Device A, Device B and Device C, click
Numeric Data Variables (Y) >>.
- Click OK. Results:
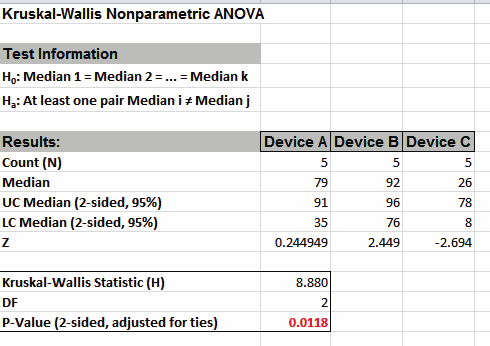
With the P-Value = .0118 we reject H0 (using alpha = .05), but
note that if we were using alpha = 0.01, we would have
incorrectly failed to reject the null hypothesis. This large
sample P-Value matches that given in the reference textbook
using Minitab.
In conclusion, whenever you have a small sample size and are
performing a Nonparametric test, always use the Exact option.


