How Do I Perform ANOM Binomial Proportions Two-Way in Excel Using SigmaXL?
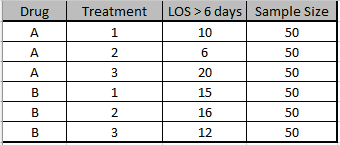
Open ANOM Examples.xlsx, click on the Length of Stay -
Binomial Prop tab. This is hospital
length of stay (LOS > 6 days) after bypass surgery. The data is
from a factorial design with
Factors: Drug (A, B) and Treatment (1, 2, 3). (Example 5.15 from
the ANOM book used with
author permission).
Click SigmaXL > Graphical Tools > Analysis of Means
(ANOM) > ANOM Binomial Proportions
Two-Way. Ensure that the entire data table is selected. If not, check
Use Entire
Data Table.
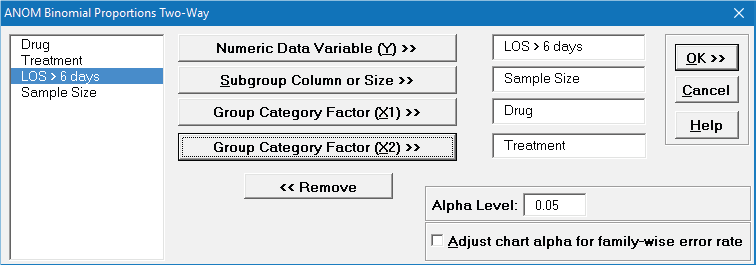
Click Next. Select
LOS > 6 days, click Numeric Data Variable (Y) >>;
select Sample Size, click Subgroup Column or Size >>;
select Drug, click
Group Category Factor (X1) >>; select Treatment, click
Group Category Factor (X2) >>.
Alpha Level = 0.05, Adjust chart alpha
for
family-wise error rate is unchecked:
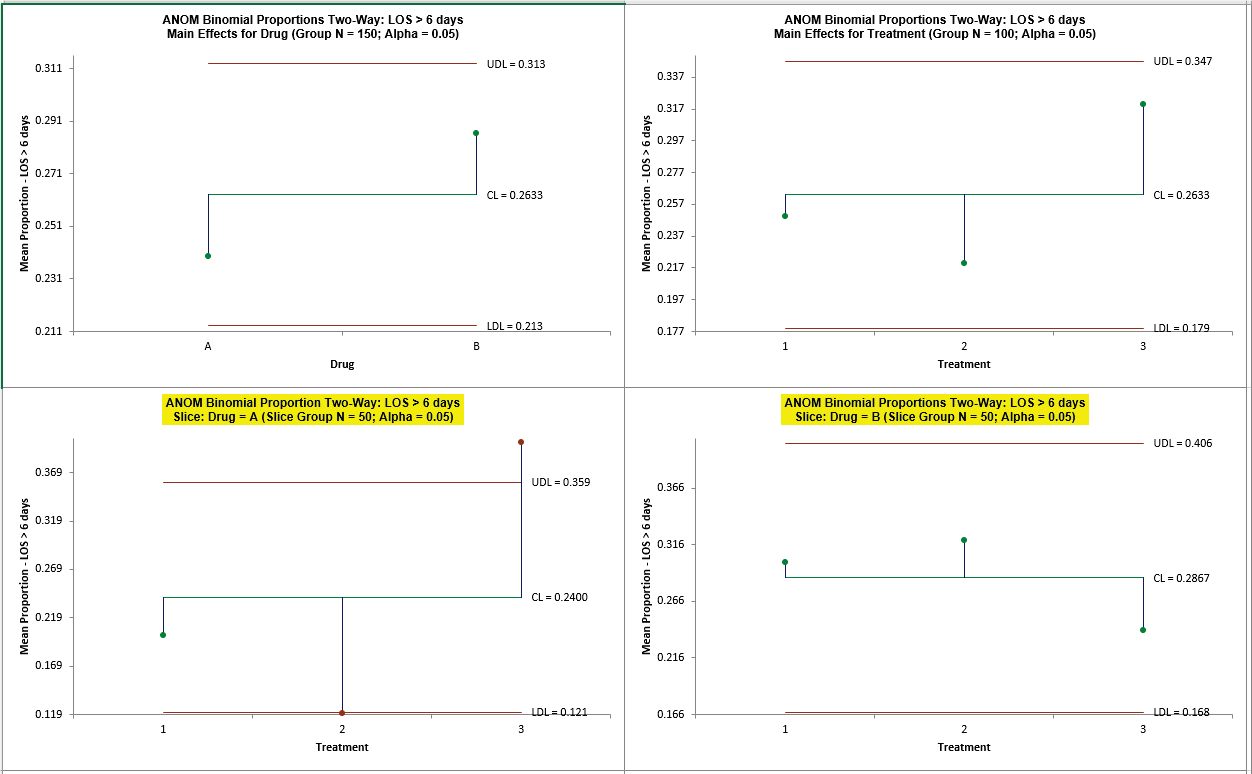
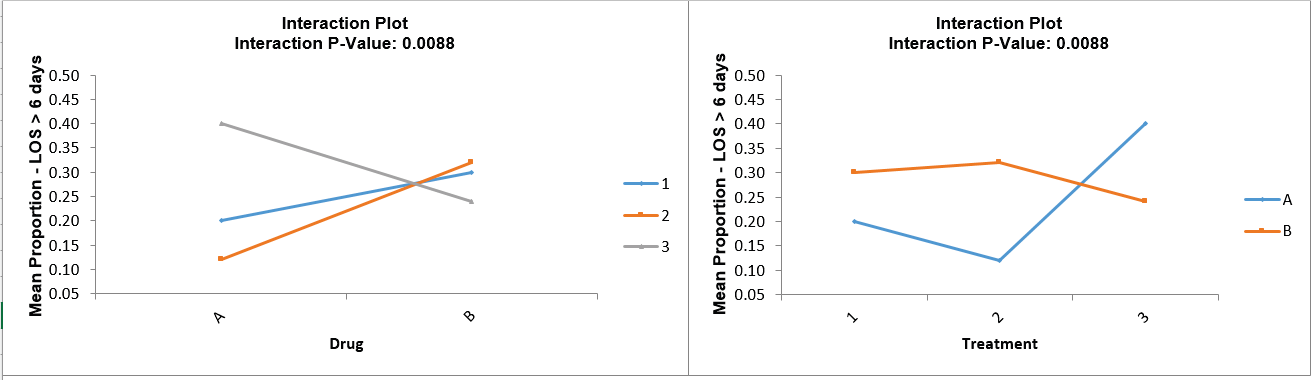
Click OK. The ANOM Binomial Proportions
Two-Way Main Effects, Slice charts and Interaction
plots are shown below:
Since the Interaction P-Value is < 0.1 (automatically determined
from Logistic regression), the
Slice charts are highlighted. The Slice plot clearly shows the
effect of the strong interaction.
When Drug = A, Treatment 2 results in a significantly lower mean
proportion LOS and
Treatment 3 results in a significantly higher LOS. When Drug =
B, the Treatment does not have
a significant effect on LOS.