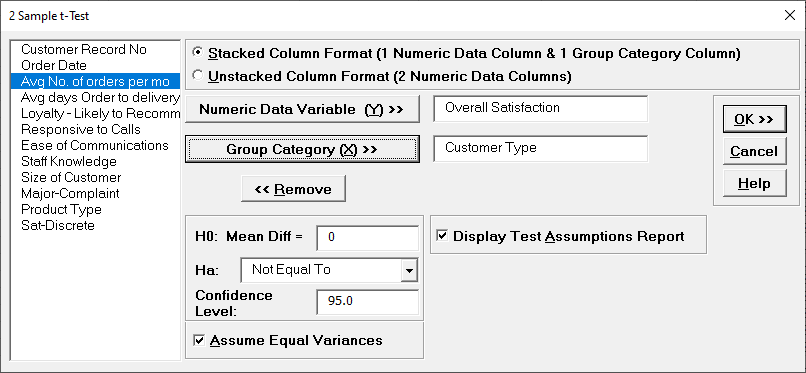
Two Sample T-Test
- Home /
- Two Sample T-Test

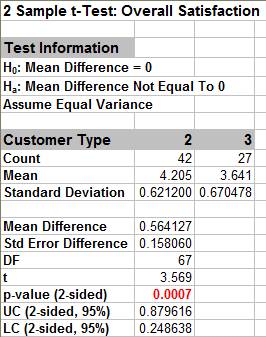
Given the p-value of .0007 we reject H0 and conclude that Mean Customer Satisfaction is significantly different between Customer type 2 and 3. This confirms previous findings.
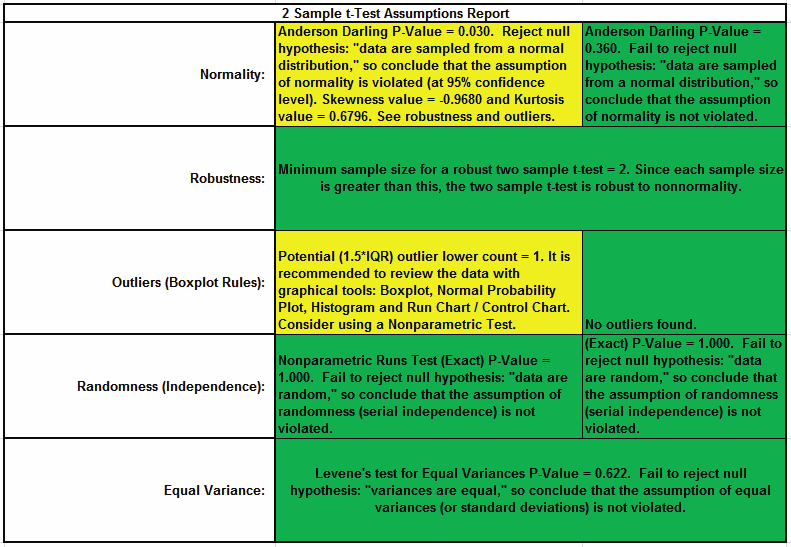
This is a text report with color highlight: Green (OK), Yellow (Warning) and Red (Serious Violation).
Each sample is tested for Normality using the Anderson Darling test. If not normal, the minimum sample size for robustness of the 2 sample t-Test is determined utilizing Monte Carlo regression equations (see Basic Statistical Templates Minimum Sample Size for Robust t-Tests and ANOVA). If the sample size is inadequate, a warning is given and the Nonparametric Mann-Whitney Test is recommended.
Each sample is tested for Outliers defined as: Potential: Tukey's Boxplot (> Q3 + 1.5*IQR or < Q1 1.5*IQR); Likely: Tukey's Boxplot 2*IQR; Extreme: Tukey's Boxplot 3*IQR. If outliers are present, a warning is given and recommendation to review the data with a Boxplot and Normal Probability Plot. Here we have a potential outlier for Customer Type 2.
Tip: If the removal of outlier(s) result in an Anderson Darling P-Value that is > 0.1, a notice is given that excluding the outlier(s), the sample data are inherently normal.
Each sample is tested for Randomness using the Exact Nonparametric Runs Test. If the sample data is not random, a warning is given and recommendation to review the data with a Run Chart.
A test for Equal Variances is also applied. If all sample data are normal, the F-Test is utilized, otherwise Levenes Test is used. If the variances are unequal and the test being used is the equal variance option, then a warning is given and Welchs test is recommended.


