How Do I Perform a Johnson Transformation in Excel Using SigmaXL?
This is a standalone tool that allows you
to visually see how the Johnson transformation selects a rounded or
optimal lambda value.
- Open the file Nonnormal Cycle Time2.xlsx.
Select Sheet 1 Tab.
- Click SigmaXL > Process Capability > Nonnormal
> Capability Combination Report (Individuals Nonnormal). Ensure that the
entire data table is
selected. If not, check Use Entire Data Table. Click
Next.
- Select Cycle Time (Minutes), click
Numeric Data Variable (Y) >>. Under
Transformation/Distribution Options, select
Johnson Transformation. You must select an Upper Spec
Limit. In this example, we have entered a USL
of 500.
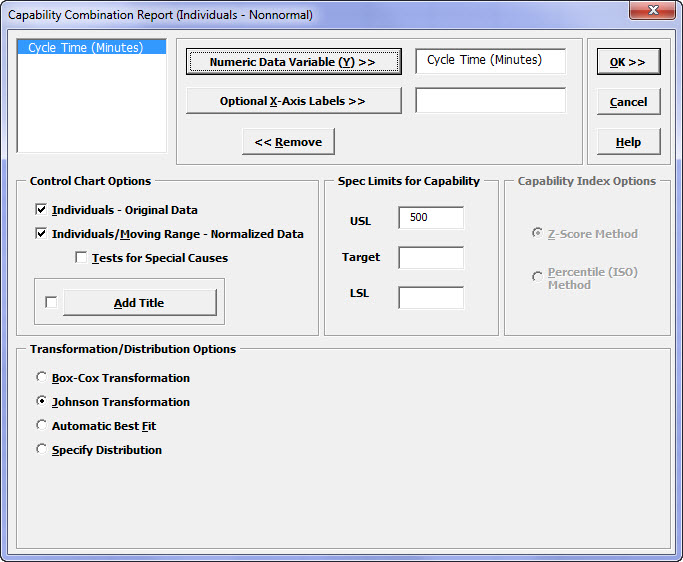
- Click OK. The resulting report is shown:
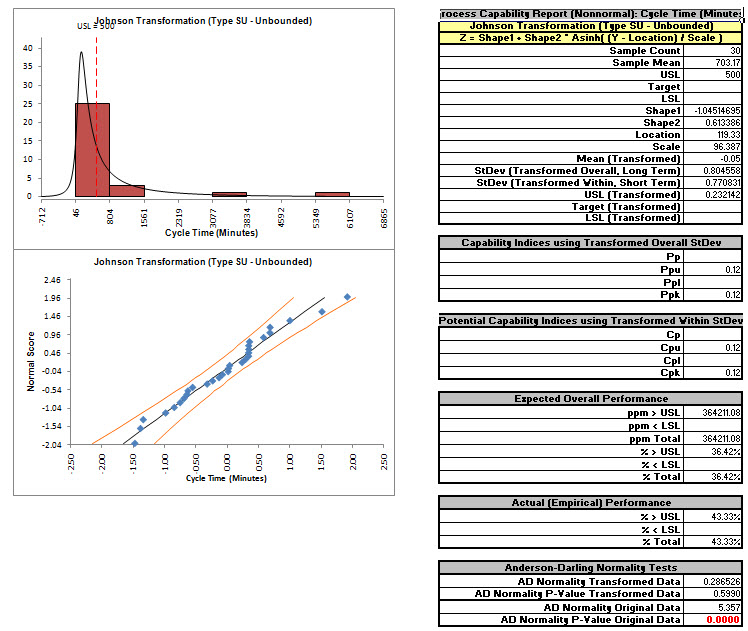
- The AD Normality P-Value
Transformed Data value of 0.5990 tells us the Johnson
transformation to normality was successful.


