Two Sample Nonparametric Test: Mann-Whitney Test - Exact (with 2 Sample
KS Option)
We will redo the example for the Two Sample Mann-Whitney Test (with 2 Sample KS
Option) to compute exact P-Values. Typically, this would not be
necessary unless the sample sizes were smaller (each sample N <= 10 for Mann-Whitney), but
this gives us continuity on the example. Due to the large number of permutations, we
will use Monte Carlo Exact for this analysis and will consider a small sample problem
later.
Open Customer Data.xlsx, click Sheet 1 tab (or
press
F4 to activate last worksheet).
Click SigmaXL > Statistical Tools > Nonparametric Tests - Exact
> 2 Sample Mann-Whitney - Exact.
If necessary, check Use Entire Data Table, click
Next.
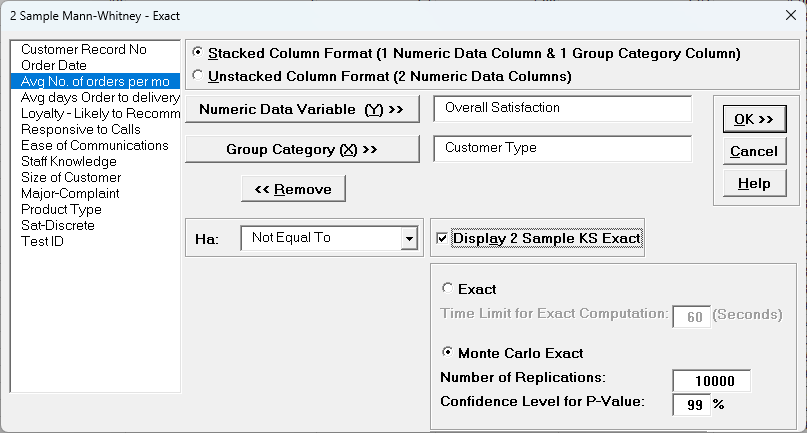
With Stacked Column Format checked, select
Overall Satisfaction, click Numeric Data Variable (Y)
>>; select
Customer Type, click Group Category (X) >>
and Ha:
Not Equal To.
Select Monte Carlo Exact with the default
Number of Replications = 10000 and Confidence Level for
P-Value
= 99%.
Check Display 2 Sample KS Exact.
Tip 1: If Exact is selected and the
computation time limit is exceeded, a dialog will prompt you to use Monte Carlo
or to increase the computation time.
Tip 2: 10,000 replications will result in a Monte Carlo P-Value
that is typically correct to two decimal places.
One million (1e6) replications will result in three decimal places of accuracy
and typically require less than 60 seconds to solve for any data set.
Tip 3: The Monte Carlo 99% confidence interval for P-Value is
not the same as a confidence interval on the test statistic due to data sampling
error.
The confidence level for the hypothesis test statistic is still 95%, so
all reported P-Values less than .05 will be highlighted in red
to indicate significance.
The 99% Monte Carlo P-Value confidence interval is due to the uncertainty in
Monte Carlo sampling, and it becomes smaller as the number of replications
increases (irrespective of the data sample size).
The Exact P-Value will lie within the stated Monte Carlo confidence interval 99%
of the time.
The KS (Kolmogorov Smirnov) Exact test is only available for Monte Carlo Exact.
Click OK. Select Customer Type 2 and
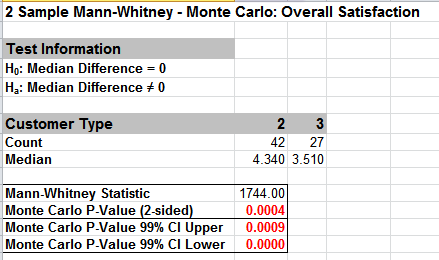
3. Click OK. The resulting output for the 2 Sample
Mann-Whitney - Monte Carlo test is:
Given the Monte Carlo P-Value of .0004 we reject H0 and conclude that Median
Customer Satisfaction is significantly different between Customer types 2 and 3.
The Monte Carlo P-Value is very close to the above large sample or asymptotic
result.
This was expected because the sample size is reasonable (each sample N > 10), so
the large sample P-Values are valid using a normal approximation for the
Mann-Whitney Statistic.
The Monte Carlo P-Value 99% confidence interval is 0.0000 to 0.0009. Note that the
Monte Carlo P-Value will be slightly different every time it is run (the Monte Carlo
seed value is derived from the system clock).
This was demonstrated using 10,000 replications, but with a P-Value this low, it is
recommended that the number of replications be increased to 1e5 or 1e6 to get a
better estimate.
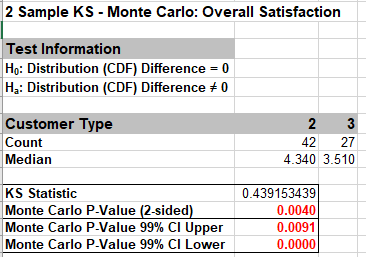
The resulting output for the 2 Sample KS - Monte Carlo test is:
Given the Monte Carlo P-Value of .004 with 99% confidence interval 0.0000 to
0.0091, we reject H0 and conclude that Satisfaction distributions are
significantly different between Customer types 2 and 3.
As with the Mann-Whitney, the Monte Carlo P-Value is very close to the above
large sample or asymptotic result.
Now we will consider a small sample problem. Open Stimulant
Test.xlsx. This data is from:
Narayanan, A. and Watts, D. Exact Methods in the NPAR1WAY Procedure, SAS
Institute Inc., Cary, NC.
Researchers conducted an experiment to compare the effects of two stimulants.
Thirteen randomly selected subjects received the first stimulant, and six
randomly selected subjects received the second stimulant.
The reaction times are in minutes.
We will test the null hypothesis of no difference between the medians of the two
stimulants against the alternative that stimulant 1 has smaller median reaction
time than stimulant 2.
Select Reaction Time tab.
Click SigmaXL > Statistical Tools > Nonparametric Tests Exact
> 2 Sample Mann-Whitney - Exact.
If necessary, check Use Entire Data Table, click
Next.
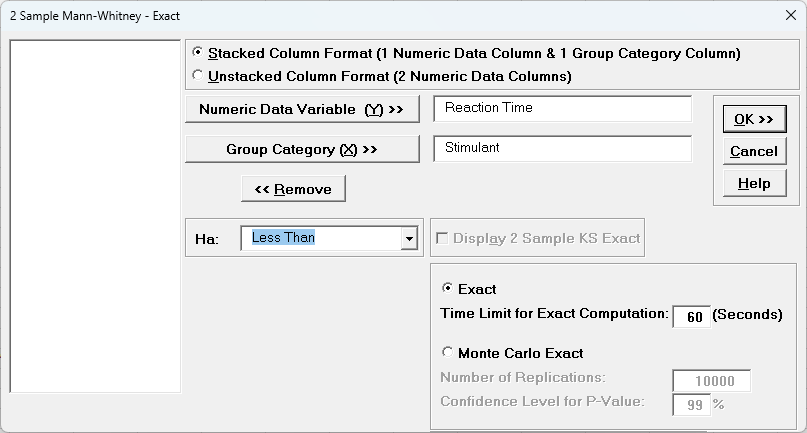
With Stacked Column Format checked, select Reaction
Time, click Numeric Data Variable (Y) >>; select
Stimulant, click Group Category (X) >>; and
Ha:Less Than.
Select Exact with the default Time Limit for Exact
Computation = 60 seconds.
The 2 Sample KS Exact option is only available for Monte Carlo, so is greyed
out.
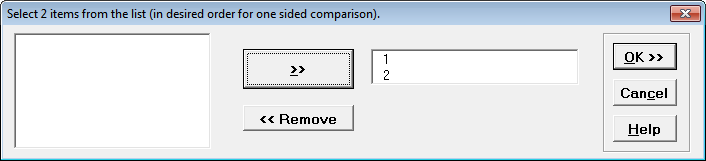
Click OK. Select Stimulant 1 and 2.
This sets the order for the one-sided test, so the alternative hypothesis Ha is
Median 1 < Median 2.
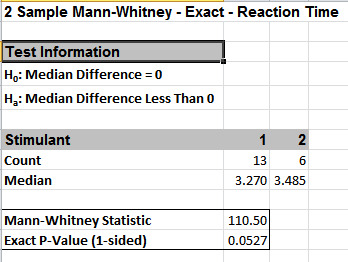
Click OK. Results:
With the P-Value = .0527 we fail to reject H0, so cannot conclude that there is
a difference in median reaction times.
This exact P-Value matches that given in the reference paper.
By way of comparison, we will now rerun the analysis using the large sample or
asymptotic Mann-Whitney test.
Select Reaction Time tab (or press F4 to
activate last worksheet).
Click SigmaXL > Statistical Tools > Nonparametric Tests Exact
> 2 Sample
Mann-Whitney.
If necessary, check Use Entire Data Table, click
Next.
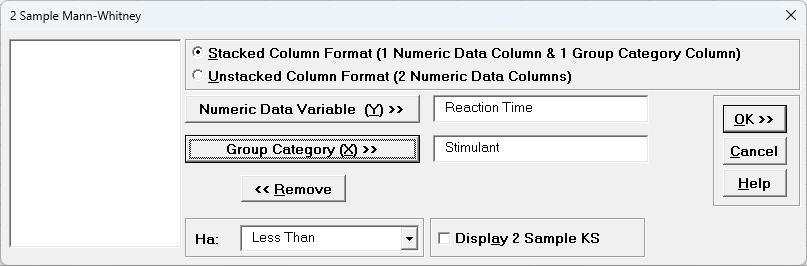
With Stacked Column Format checked, select
Reaction Time, click Numeric Data Variable (Y)
>>;
select Stimulant, click Group Category (X) >>;
and Ha: Less Than. Display 2 Sample
KS is left unchecked.
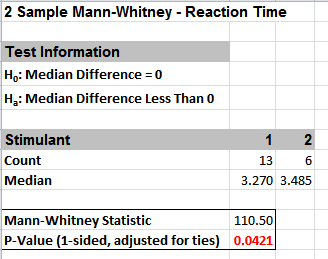
Click OK. Select Stimulant 1 and 2. Click
OK. Results:
Now with the P-Value = .0421 we incorrectly reject H0.
The difference between exact and large sample P-Value is small but it was enough
to lead us to falsely conclude that stimulant 1 resulted in a reduced median
reaction time.
In conclusion, whenever you have a small sample size and are performing a
nonparametric test, always use the Exact option.