Include Top

Two Sample Nonparametric Test: Mann-Whitney


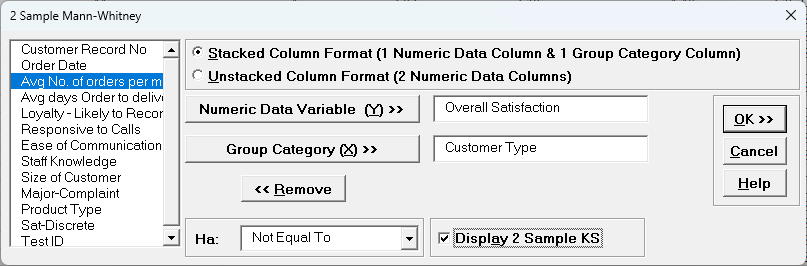
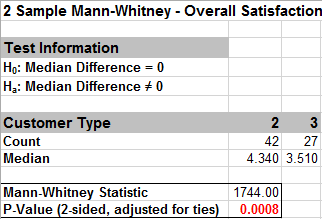
We will look at comparing medians of Customer Satisfaction by Customer Type, using the Two Sample Mann-Whitney test with H0: Median Difference = 0, Ha: Median Difference ≠ 0. The Two Sample Mann-Whitney Test is the nonparametric equivalent to the parametric Two Sample t-Test (i.e., Two Sample t-Test on Ranks). The test does not assume sample normality but does assume that the samples have equal shapes. If the shapes are different, the null hypothesis is that the distributions are the same.

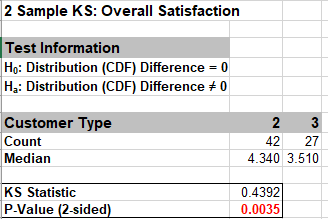
The optional Two Sample KS (Kolmogorov-Smirnov) test is used to compare the distributions of two samples. The test is H0: Distribution (CDF) Difference = 0, Ha: Distribution (CDF) Difference ≠ 0. The CDF is the Cumulative Distribution Function. The two-sided test statistic is the maximum absolute difference between the CDF values as shown:

Empirical/Normal CDF Plot of Customer Type

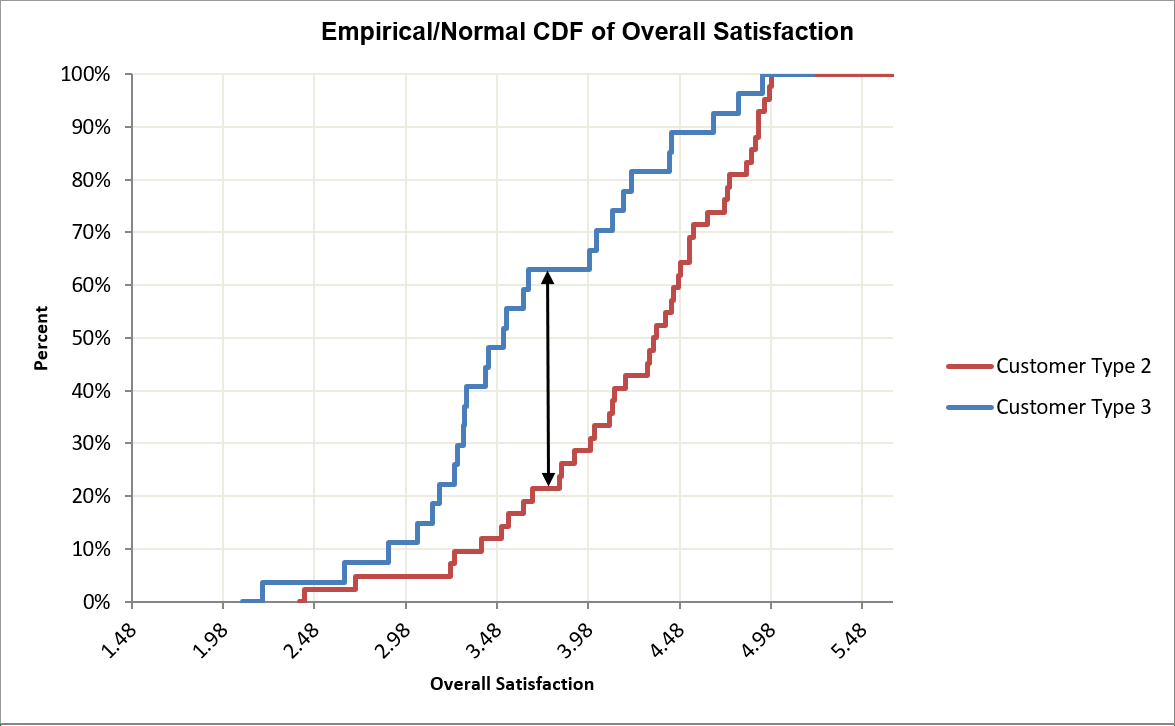
Note this graph may be recreated using SigmaXL > Graphical Tools > Empirical/Normal CDF Plots. Display Normal CDF Plots is unchecked. Copy and Paste Customer Type 3 plot into Customer Type 2. Adjust legend and axis labels.

Two Sample Mann-Whitney Test (with 2 Sample KS Option)

  1. Open Customer Data.xlsx, click Sheet 1 tab (or press F4 to activate last worksheet).

  2. Click SigmaXL > Statistical Tools > Nonparametric Tests > 2 Sample Mann-Whitney. If necessary, check Use Entire Data Table, click Next.

  3. With Stacked Column Format checked, select Overall Satisfaction, click Numeric Data Variable (Y) >>; select Customer Type, click Group Category (X) >>; and Ha: Not Equal To. Check Display 2 Sample KS.

    2 Sample Mann-Whitney

  4. Click OK. Select Customer Type 2 and 3.

    Customer Type Comparison

  5. Click OK. The resulting output for the 2 Sample Mann-Whitney test is:

    Mann-Whitney Results

    Given the p-value of .0008 we reject H0 and conclude that Median Customer Satisfaction is significantly different between Customer types 2 and 3. This confirms previous findings and matches the results of the 2 Sample t-Test.

  6. The resulting output for 2 Sample KS test is:

    Mann-Whitney KS Test Results

    Given the P-Value of .0035 we reject H0 and conclude that the Satisfaction distributions are significantly different between Customer types 2 and 3. This agrees with the results for the Mann-Whitney test.
 

Define, Measure, Analyze, Improve, Control

Lean Six Sigma Software Excel Add-in

Simulate, Optimize,
Realize

Lean Six Sigma Software Excel Add-in

Web Demos

Our CTO and Co-Founder, John Noguera, regularly hosts free Web Demos featuring SigmaXL and DiscoverSim
Click here to view some now!

Contact Us

Phone: 1.888.SigmaXL (744.6295)

Support: Support@SigmaXL.com

Sales: Sales@SigmaXL.com

Information: Information@SigmaXL.com