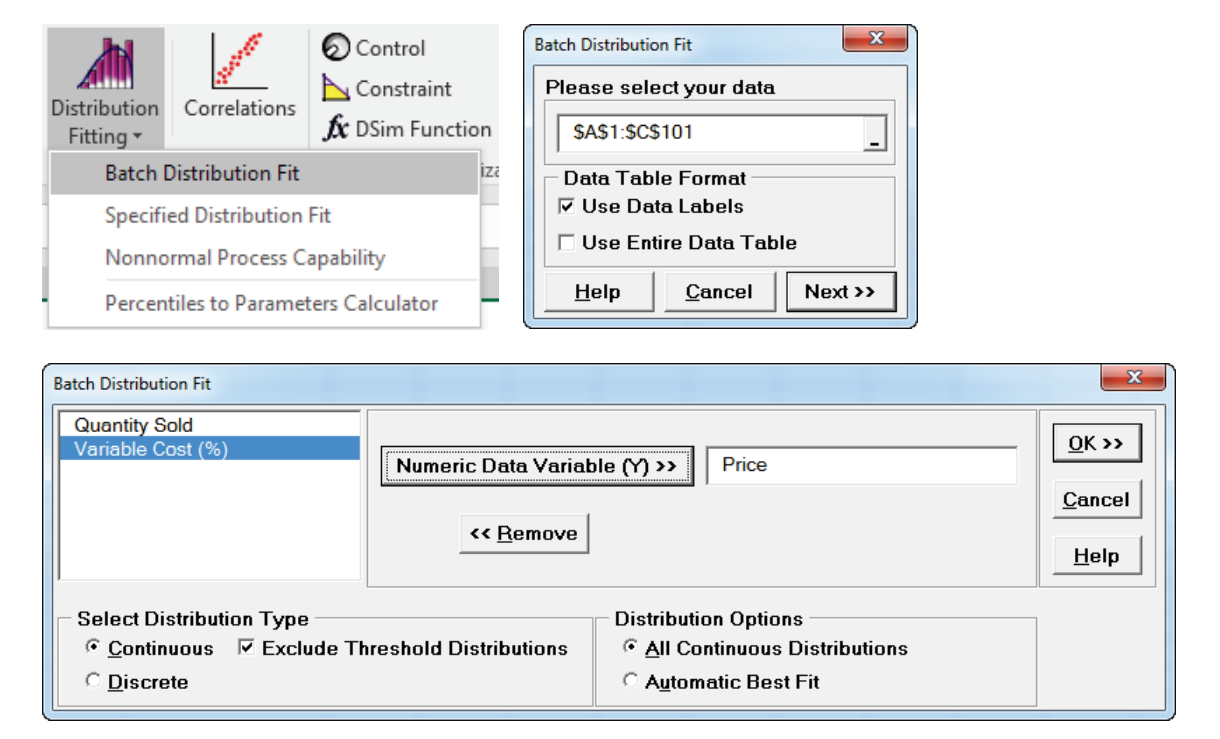
Select Continuous or Discrete.
Continuous distributions will be sorted in ascending order using the Anderson Darling goodness of fit statistic.
Discrete distributions will be sorted with the Chi-Square goodness of fit statistic.
P-Values and distribution parameter values are also reported for each distribution.
Check Exclude Threshold Distributions to run the batch distribution fit without estimation of distributions that have a Threshold parameter. The default is checked because it is much faster. Note, however, that if the data contains negative values then Threshold distributions will be included in the batch fit. Tip: If Threshold distributions are included, and two candidate distributions with similar Anderson Darling statistic values are being considered, one with a Threshold and one without, choose the simpler model without the Threshold. For further details on Threshold distributions and estimation, see Appendix: Distribution Fitting – Threshold Distributions.
Select All Distributions or Automatic Best Fit. Automatic Best Fit will return the distribution with the lowest Anderson-Darling or Chi-Square statistic.
If distribution fitting has been performed, the Select Stored Distribution Fit option will become available in the
Input Distribution dialog for selection of variable name(s) and stored distribution(s). The input distribution parameter values will automatically be populated.
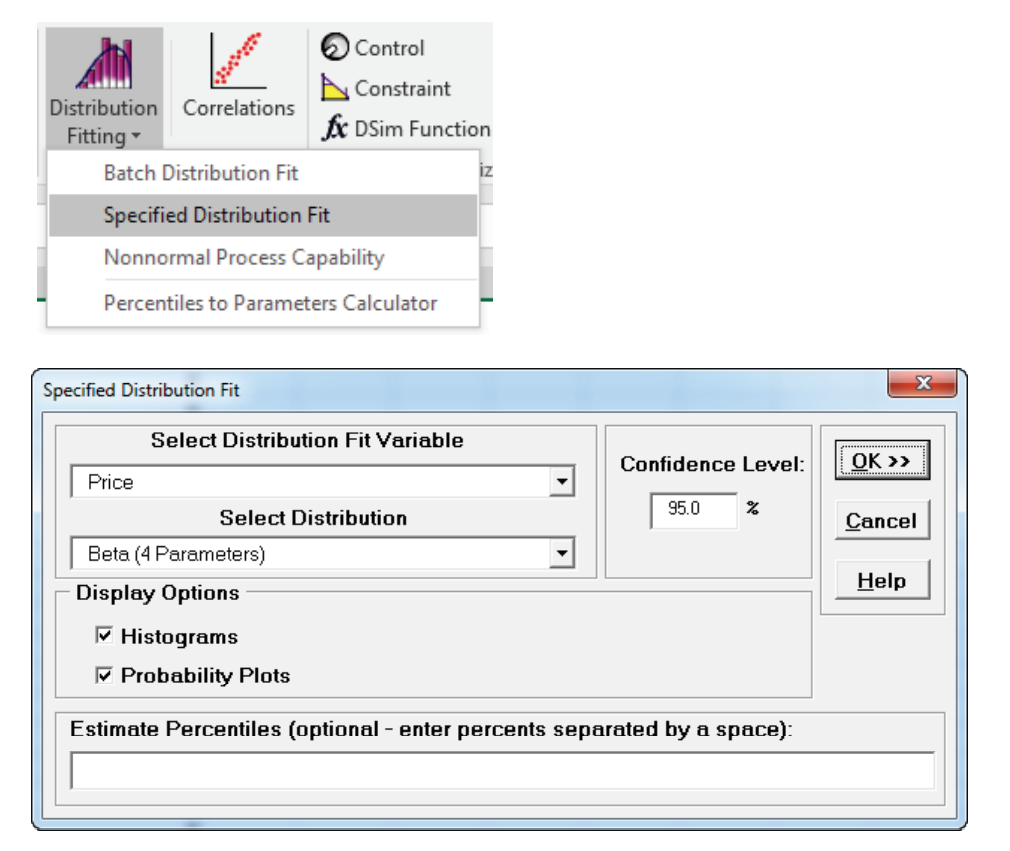
Distribution Fitting: Specified Distribution Fitting
Specified Distribution Fit provides a more detailed distribution fit report for a selected variable and specified distribution.
Select Distribution Fit Variable and Select Distribution provide a drop down list with available variable/distribution options from the Batch Distribution Fit (similar to Select Stored Distribution Fit in the Create/Edit Input Distribution dialog).
The Specified Distribution Fit report includes:
Histogram and Probability Plot (optional with check box).
Parameter estimates, standard errors (SE Estimate) and confidence intervals for parameter estimates.
The Confidence Level can be set in the dialog above with default value = 95%.
In some cases standard errors and confidence intervals may not be available.
Percentile Report with the following percentiles: 0.135, 1, 5, 10, 15, 20, 25, 30, 35, 40, 45, 50, 55, 60, 65, 70, 75, 80, 85, 90, 95, 99, 99.865.
Other values can be added by entering in the Estimate Percentiles box.
Note that the percentiles are computed using the distribution and estimated parameters, not the empirical data as is the case with the percentiles in the simulation report.
Standard errors and confidence
intervals for the percentile values, at the Confidence Level
specified above (95% default).
In some cases standard errors and confidence intervals may not be available.
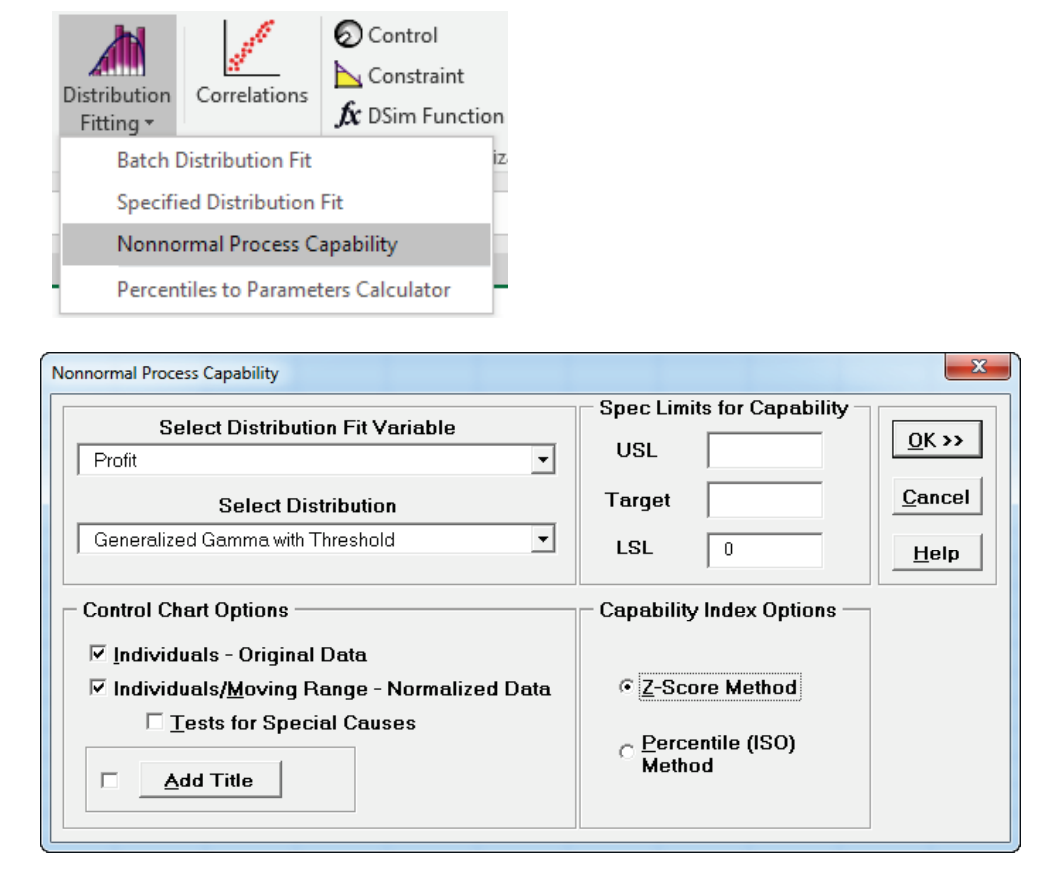
Distribution Fitting: Nonnormal Process Capability
Nonnormal Process Capability provides a nonnormal process capability report with capability indices computed from the
specified distribution with estimated parameters.
Empirical Performance is also reported for comparison.
Capability indices are for individual observations (subgrouping is not available).
Select Distribution Fit Variable and Select Distribution provide a drop down list with available variable/distribution options from the Batch Distribution Fit (similar to Select Stored Distribution Fit in the Create/Edit Input Distribution dialog).
Enter Upper Specification Limit (USL) and/or Lower Specification Limit (LSL).
Target is optional (used in the Cpm calculation).
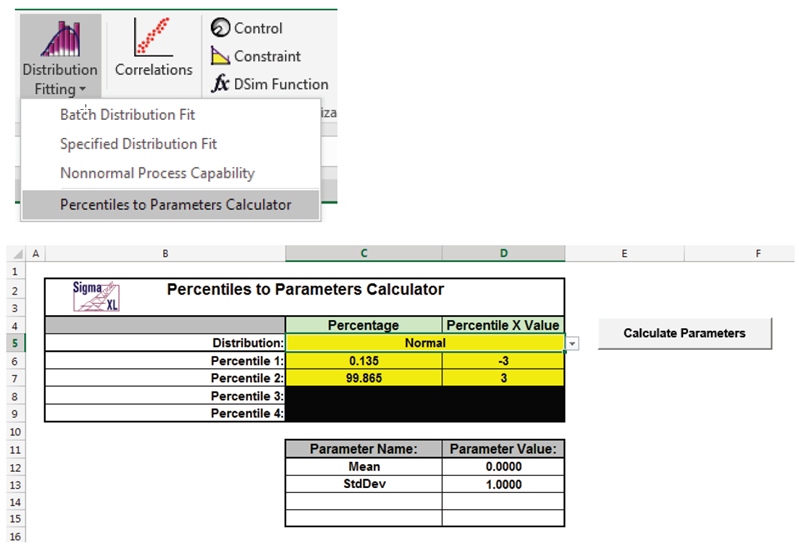
Distribution Fitting: Percentiles to Parameters Calculator
If one does not have sufficient data to do distribution fitting but does know some percentile values of a specified distribution, these can be converted to parameter values for use in simulation.
Select Distribution using drop down. Select Percentage values using drop down. Enter Percentile X Values.
Percentiles not used by a distribution are blacked out.
Click Calculate Parameters. Parameter Name and Values are shown in cells C12 to D15.
If the Parameter Value cells are blank, please ensure that the Percentile X Values are viable for the chosen distribution.
Due to the complexity of calculations, this template uses VBA macros rather than Excel formulas. DiscoverSim must be initialized and appear on the menu in order for this template to function.


 Facebook
 LinkedIn
 YouTube