The Empirical/Normal CDF (Cumulative Distribution Function) Plot shows the data values sorted from lowest to highest on the X axis with the respective percentiles (percentages) on the Y axis and may be compared against the same for the fitted Normal Distribution. It is similar to the Normal Probability Plot but instead of a straight line it will form an "S-shaped" curve. The empirical data is plotted as a blue stepped line, whereas the fitted normal distribution is shown as a smooth red line. Large deviations between the two indicate that the data are not normally distributed.
Examples - Empirical/Normal CDF Plots
We will repeat the examples used for Normal Probability Plots. Click SigmaXL Random Data (1) Sheet (if not available please do Steps 1 and 2 given
in the example).
Click SigmaXL > Graphical Tools > Empirical/Normal CDF Plots. Ensure that the entire data table is selected. If not, check Use Entire Data Table. Click Next.
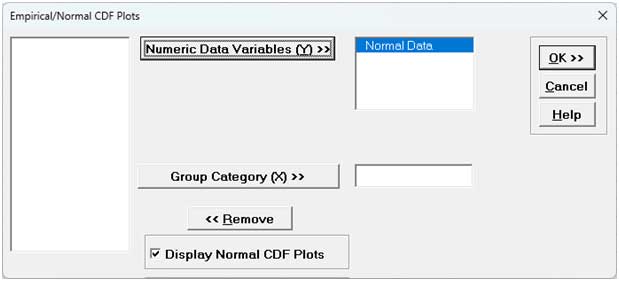
Select Normal Data, click Numeric Data Variables (Y) >>. Check Display Normal CDF Plots.
Note that Empirical/Normal CDF Plots permit multiple Y variables. If more than one Y is selected Group Category (X) is greyed out.
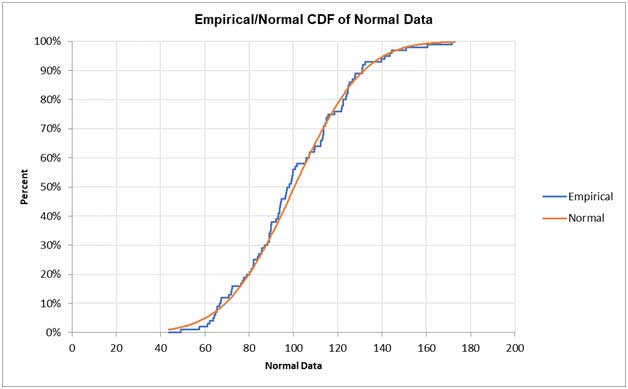
Click OK. An Empirical/Normal CDF Plot of the simulated random data is produced (your plot will be slightly different due to the random number generation):
The Empirical CDF plot follows the Normal CDF fairly well, indicating that the data is normally distributed.
Click Sheet 1 Tab of Customer Data.xlsx.
Click SigmaXL > Graphical Tools > Empirical/Normal CDF Plots. Ensure that the entire data table is selected. If not, check Use Entire Data Table. Click Next.
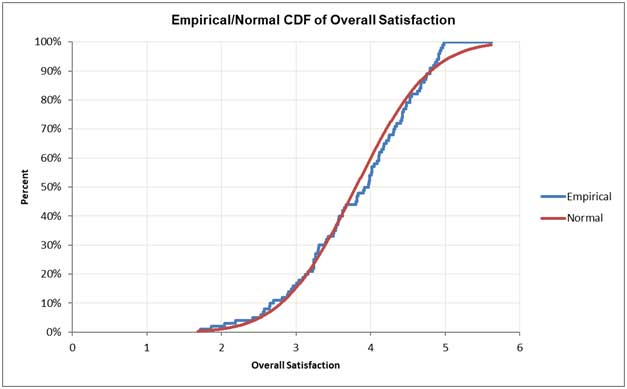
Select Overall Satisfaction; click Numeric Data Variables (Y) >>. Click OK. An Empirical/Normal CDF Plot of the Overall Satisfaction data is produced:
The Empirical CDF plot does not follow the Normal CDF well, indicating that the data is not normally distributed. The Empirical curve hits 100% at Overall Satisfaction = 5 since that was the maximum possible survey value, resulting in a skewed left distribution as noted in the histogram.
Now we would like to stratify the customer satisfaction score by customer type and look at the Empirical/Normal CDF plots.
Click Sheet 1 of Customer Data.xlsx. Click SigmaXL > Graphical Tools > Empirical/Normal CDF Plots . Ensure that Entire Table is selected, click Next. (Alternatively, press F3 or click Recall SigmaXL Dialog to Recall Last Dialog).
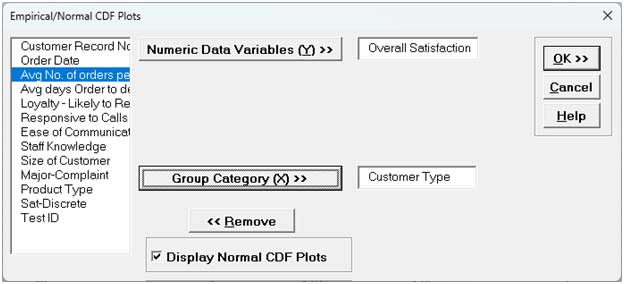
Select Overall Satisfaction, click Numeric Data Variables (Y) >>; select Customer Type as Group Category (X) >>.
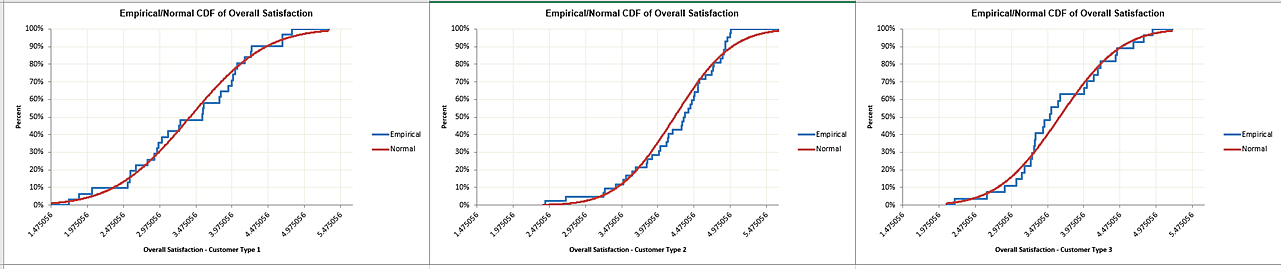
Click OK. Empirical/Normal CDF Plots of Overall Satisfaction by Customer Type are produced:
We can see that the Empirical CDF plot for Customer Type 2 does not follow the Normal CDF well, indicating that the data is not normally distributed. The Empirical curve hits 100% at Overall Satisfaction = 5 since that was the maximum possible survey value, resulting in a skewed left distribution as noted in the histogram.
Customer Types 1 and 3 are harder to interpret, so we would use normal probability plots and normality tests to complement these plots to assess normality.
Tip: Empirical CDF Plots may also be compared against each other by using Excel's copy/paste for the graphs. In this case, it is recommended to uncheck the Display Normal CDF Plots option when creating the plots. The Two Sample KS Test is a formal test used to compare two empirical CDFs. See Two Sample Mann-Whitney Test (with 2 Sample KS Option).