Chi-Square Test Two Way Table Data Fishers Exact
The Chi-Square Test Fishers Exact utilizes permutations and
fast network algorithms to solve the Exact Fisher P-Value for
contingency (two-way row*column) tables. This is an extension of the
Fisher Exact option provided in the Two Proportion Test template.
For data that requires more computation time than specified, Monte
Carlo P-Values provide an approximate (but unbiased) P-Value that
typically matches exact to two decimal places using 10,000
replications. One million replications give a P-Value that is
typically accurate to three decimal places. A confidence interval
(99% default) is given for the Monte Carlo P-Values. For further
details refer to the Appendix: Exact and Monte Carlo P-Values for
Nonparametric and Contingency Tests.
It is important to note that while exact P-Values are correct, they do not increase (or decrease) the power of a small sample test, so they are not a solution to the problem of failure to detect a change due to inadequate sample size!
- We will now re-analyze the data from the Chi-Square Test & Association example for Major Complaint by Customer
Type. Open Customer Data.xlsx. Click
Sheet 1 tab. The discrete data of interest is
Complaints and Customer Type, i.e., does the type of complaint
differ across customer type? Formally the Null Hypothesis is
that there is no relationship (or independence) between Customer
Type and Complaints.
- Click SigmaXL > Statistical Tools > Chi-Square
Tests Exact > Chi-Square Test Fishers Exact. Ensure that the
entire data table is selected. If not, check Use Entire Data Table.
Click Next.
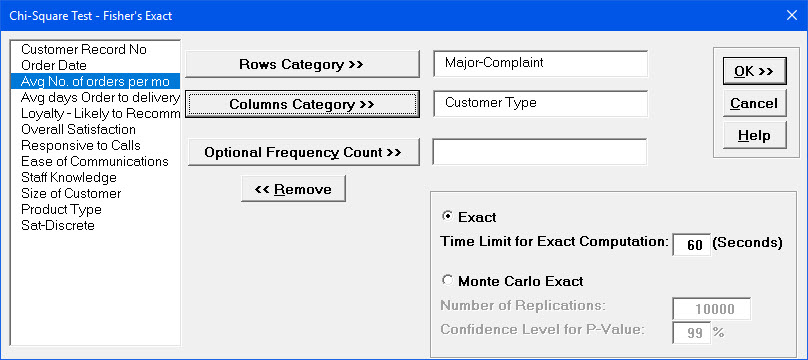
- Select Major-Complaint,
click Count Category (X1) >>; select
Customer Type, click Group Category (X2)
>>. Select Exact with the default Time
Limit for Exact Computation = 60 seconds.
Tip: If the exact computation time limit is exceeded a dialog will prompt you to use Monte Carlo or to increase the computation time.
When this occurs, Monte Carlo is recommended.
- Click OK. Results:
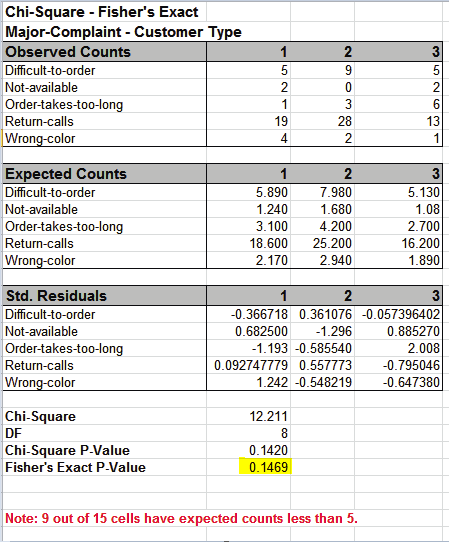
With Fishers Exact P-Value = 0.1469 we fail
to reject H0, so we cannot conclude that there is a difference in
customer complaints across customer types. This is close to the
approximate Chi-Square P-Value of 0.142, so either P-Value results
in the same conclusion.
However, there are cases where the large sample Chi-Square
P-Value leads to one conclusion but Fishers Exact P-Value gives
another. This will be demonstrated later using Two Way Table Data
Fishers Exact.
The Exact P-Value was computed very quickly,
but if the data set was larger, the required computation time could
become excessive, and Monte Carlo would be required. We will rerun
this analysis with Monte Carlo and discuss the output report.
- Press F3 or click
Recall SigmaXL Dialog to Recall Last Dialog.
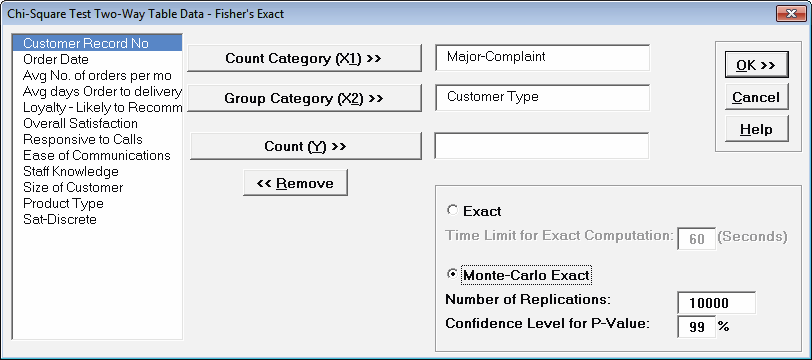
Select Monte Carlo Exact with the default
Number of Replications = 10000 and
Confidence Level for P-Value = 99%.
Tip: As discussed above 10,000 replications will result in a
Monte Carlo P-Value that is correct to two decimal places. One
million (1e6) replications will result in three decimal places of
accuracy and typically require less than 60 seconds to solve for any
data set.
Tip: The Monte Carlo 99% confidence interval for P-Value is not the same as a confidence interval on the test statistic due to data sampling error.
The confidence level for the hypothesis test statistic is still 95%, so all reported P-Values less than .05 will be highlighted in red to indicate significance.
The 99% Monte Carlo P-Value confidence interval is due to the uncertainty in Monte Carlo sampling, and it becomes smaller as the number of replications
increases (irrespective of the data sample size). The Exact P-Value will lie within the stated Monte Carlo confidence interval 99% of the time.
- Click OK. Results:
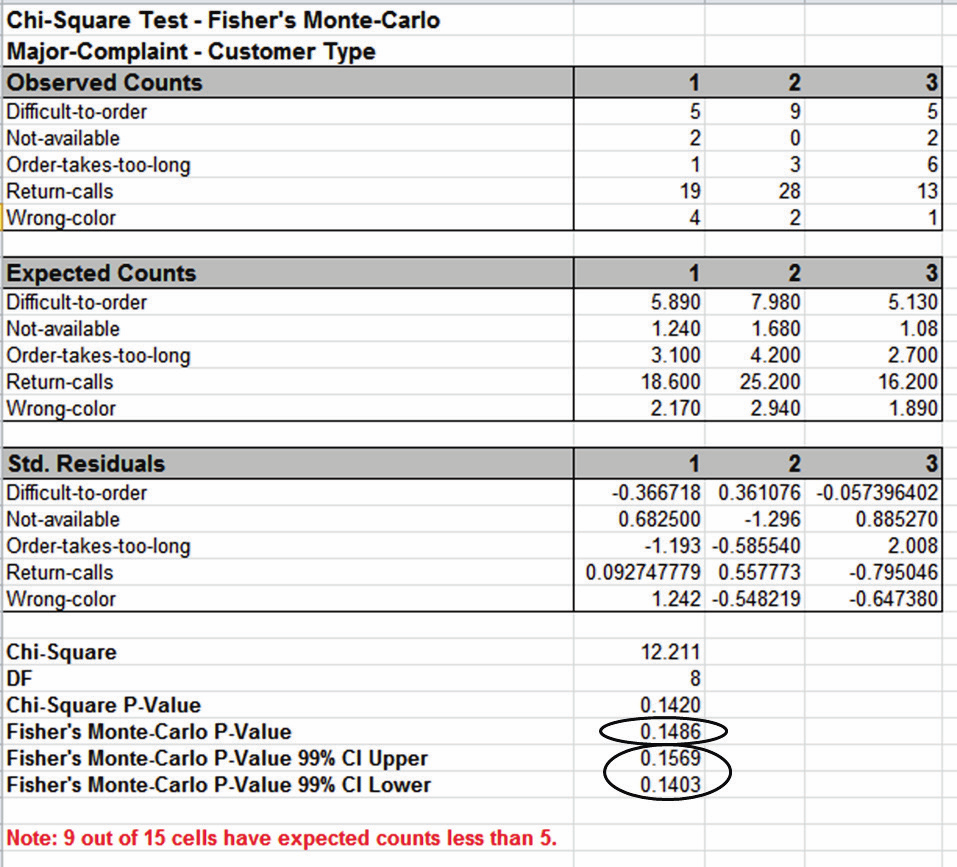
Fishers Monte Carlo P-Value here is 0.1486 with a 99% confidence
interval of 0.1403 to 0.1569. This will be slightly different every
time it is run (the Monte Carlo seed value is derived from the
system clock). The true Exact P-Value = 0.1469 lies within this
confidence interval. If the confidence interval is too wide (e.g.,
upper fail-to-reject H0 and lower reject H0), simply rerun the
Monte Carlo option using a larger number of replications (use 1e5 or
1e6).
