Click SigmaXL > Templates & Calculators > Control Chart Templates > Trend. This template is also located at SigmaXL > Control Charts > Control Chart Templates > Trend.
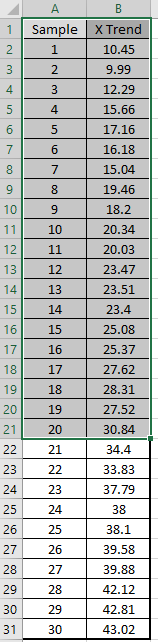
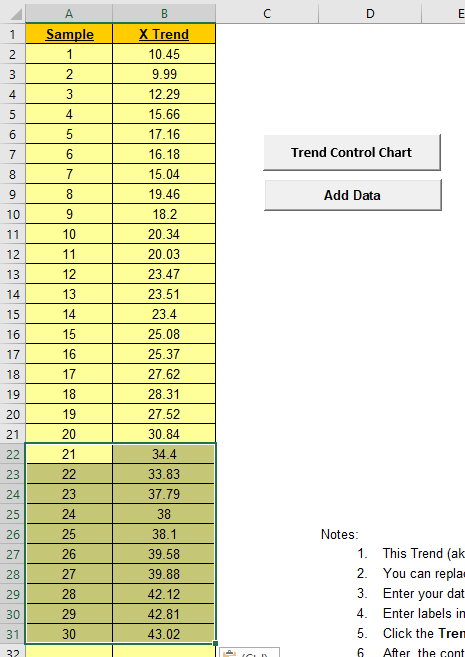
Open Trend Chart Example.xlsx (Sheet 1 tab). We will use Sample 1 to 20 to construct the Trend Control Chart and then add Sample 21 to 30 to this chart..
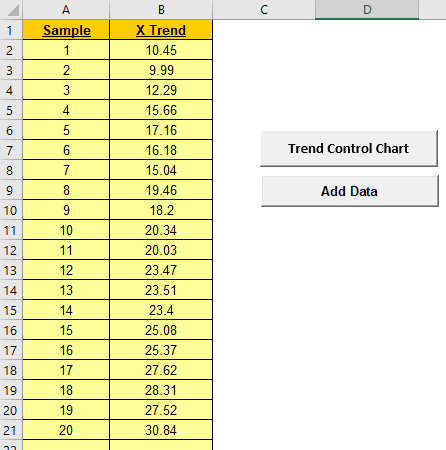
Copy cells A1:B21 and Paste Values to the template at A1.
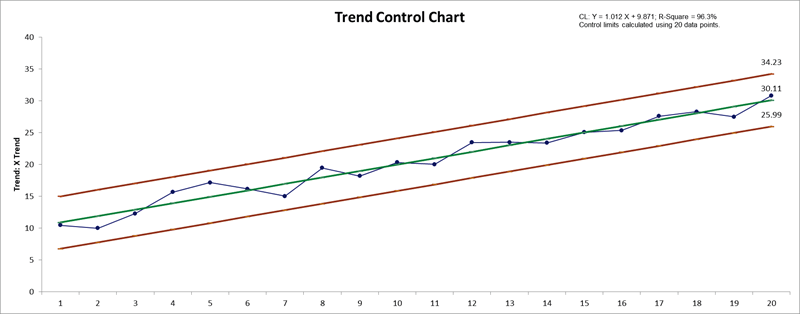
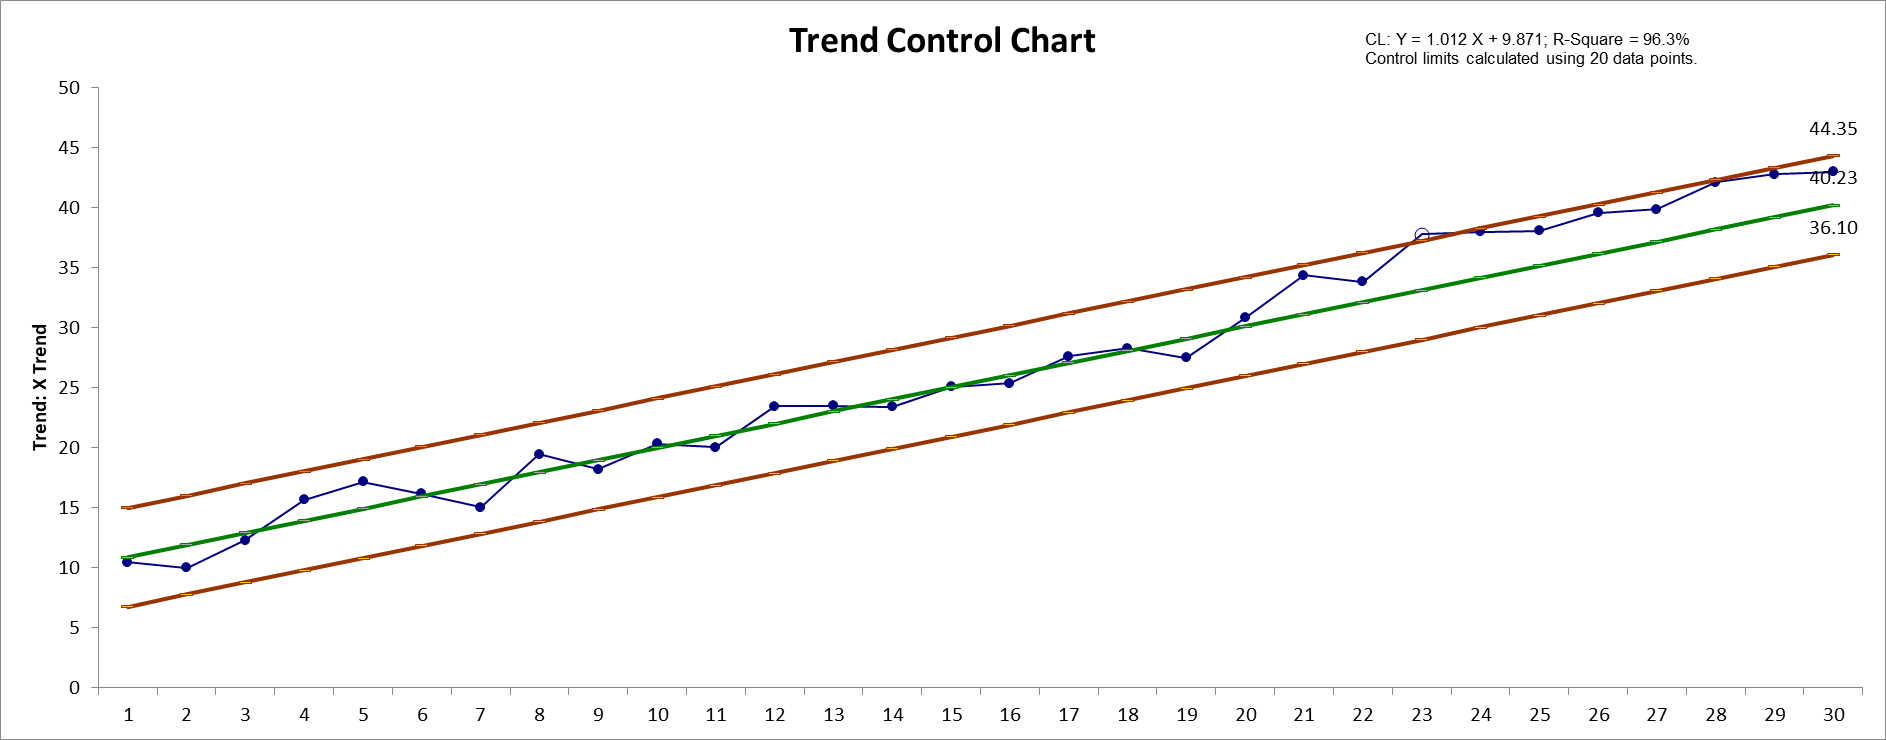
Click the Trend Chart button to create the Trend Chart:
This confirms that the process is in-control after taking the trend into account. The regression equation and R-Square are reported, with R-Square = 96.3% well above the recommended 80%.This confirms that the process is in-control.
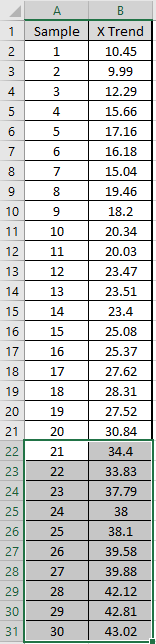
Switch back to Trend Chart Example (Sheet 1 tab). Select and copy the data A22: B31 as shown.
Switch to the Trend template and Paste Values to cell A23 as shown.
Click the Add Data button to add the new data to the Trend Control Chart:
This confirms that the process is now out-of-control, so corrective action to find and remove the assignable cause is needed.
The Trend Control Chart template should be used with continuous data. The data must be in chronological time-sequence order and has a consistent positive or negative linear trend which is inherent to the process. This is also known as a Toolwear Control Chart.
Center line (CL) is the linear regression equation. Stdev is estimated using MR-bar/1.128 of regression residuals.
Note that the regression model estimation error is not included in the calculation of the control limits. R-Square should be at least 50%, preferably greater than 80%.
Trend control limit formulas are given in Provost L, Murray S., The Health Care Data Guide: Learning from Data for Improvement. San Francisco: Jossey-Bass, 2011, p. 254.
Alternatively, a regular Individuals Chart may be constructed on the regression model residuals.
Template Notes and References:
This Trend (aka Toolwear) Control Chart template should be used with continuous data. The data must be in chronological time-sequence order and has a consistent positive or negative linear trend which is inherent to the process.
You can replace the X-Axis Label and Data column headings with any headings that you wish.
Enter your data in the Data column.
Enter labels in X-Axis Label column. Labels can be Date, Time, Name, or other text information. These labels are optional and will appear on the horizontal X-Axis of the Trend Control Chart.
Click the Trend Control Chart button to create a Trend Control Chart.
After the control chart has been created and additional new data entered into the Data column, click the Add Data button to add the data to the existing chart. Control limits will be calculated using the original chart slope, intercept and stdev.
Add Data should only be used if there are at least 20 observations in the original chart.
Center line (CL) is the linear regression equation. Stdev. is estimated using MR-bar/1.128 of regression residuals.
Note that the regression model estimation error is not included in the calculation of the control limits. R-Square should be at least 50%, preferably greater than 80%.
Reference: Trend control limit formulas are given in Provost L, Murray S., The Health Care Data Guide: Learning from Data for Improvement. San Francisco: Jossey-Bass, 2011, p. 254.