Tabular CUSUM
- Home /
- Tabular CUSUM

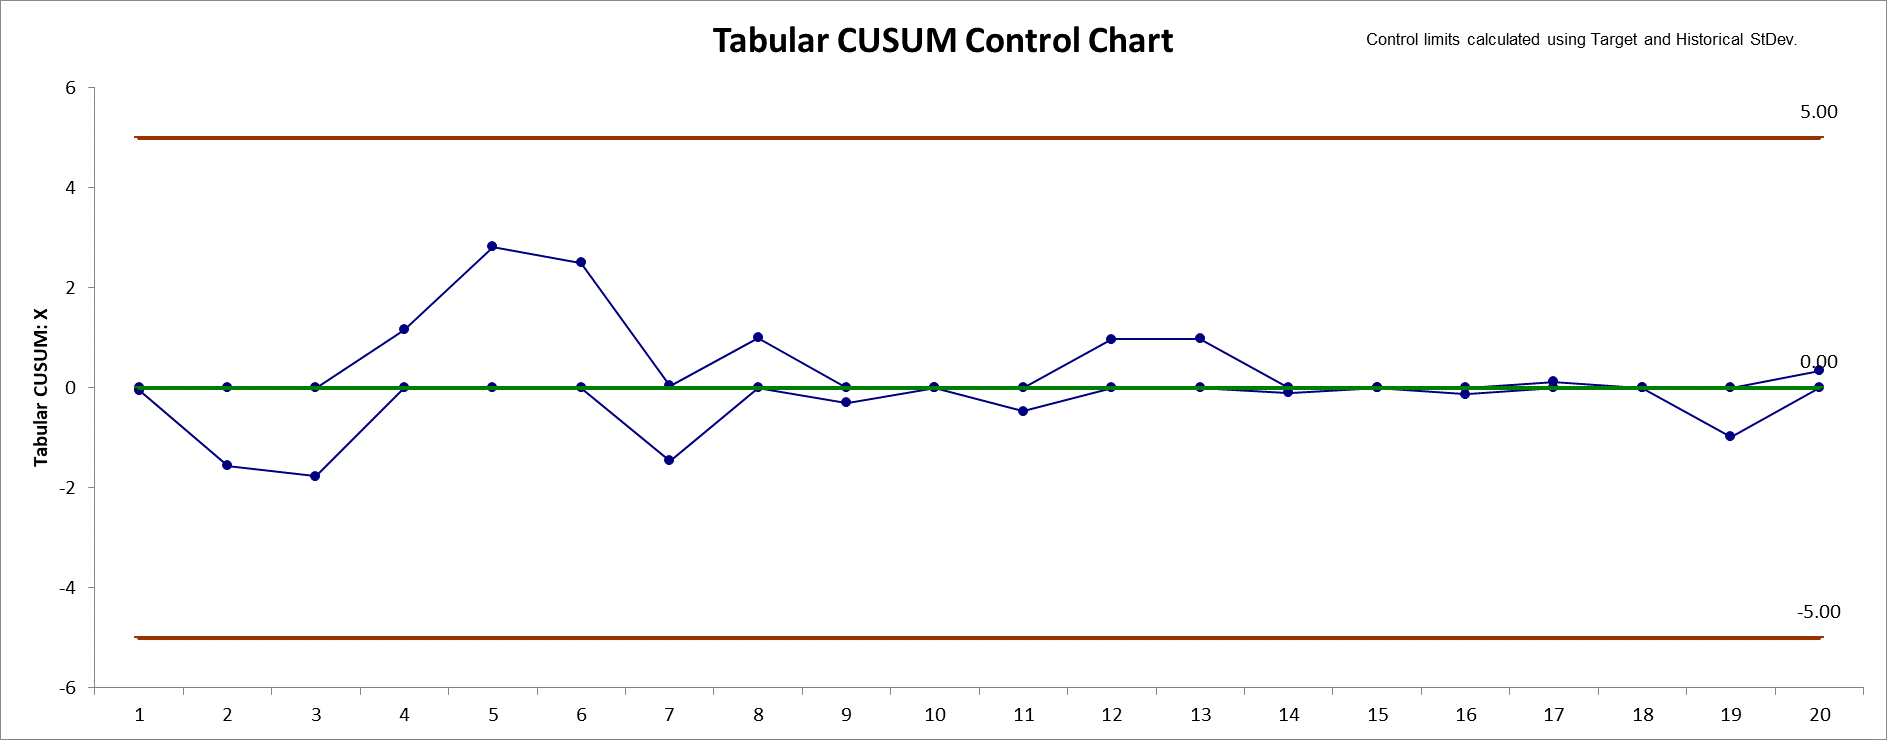
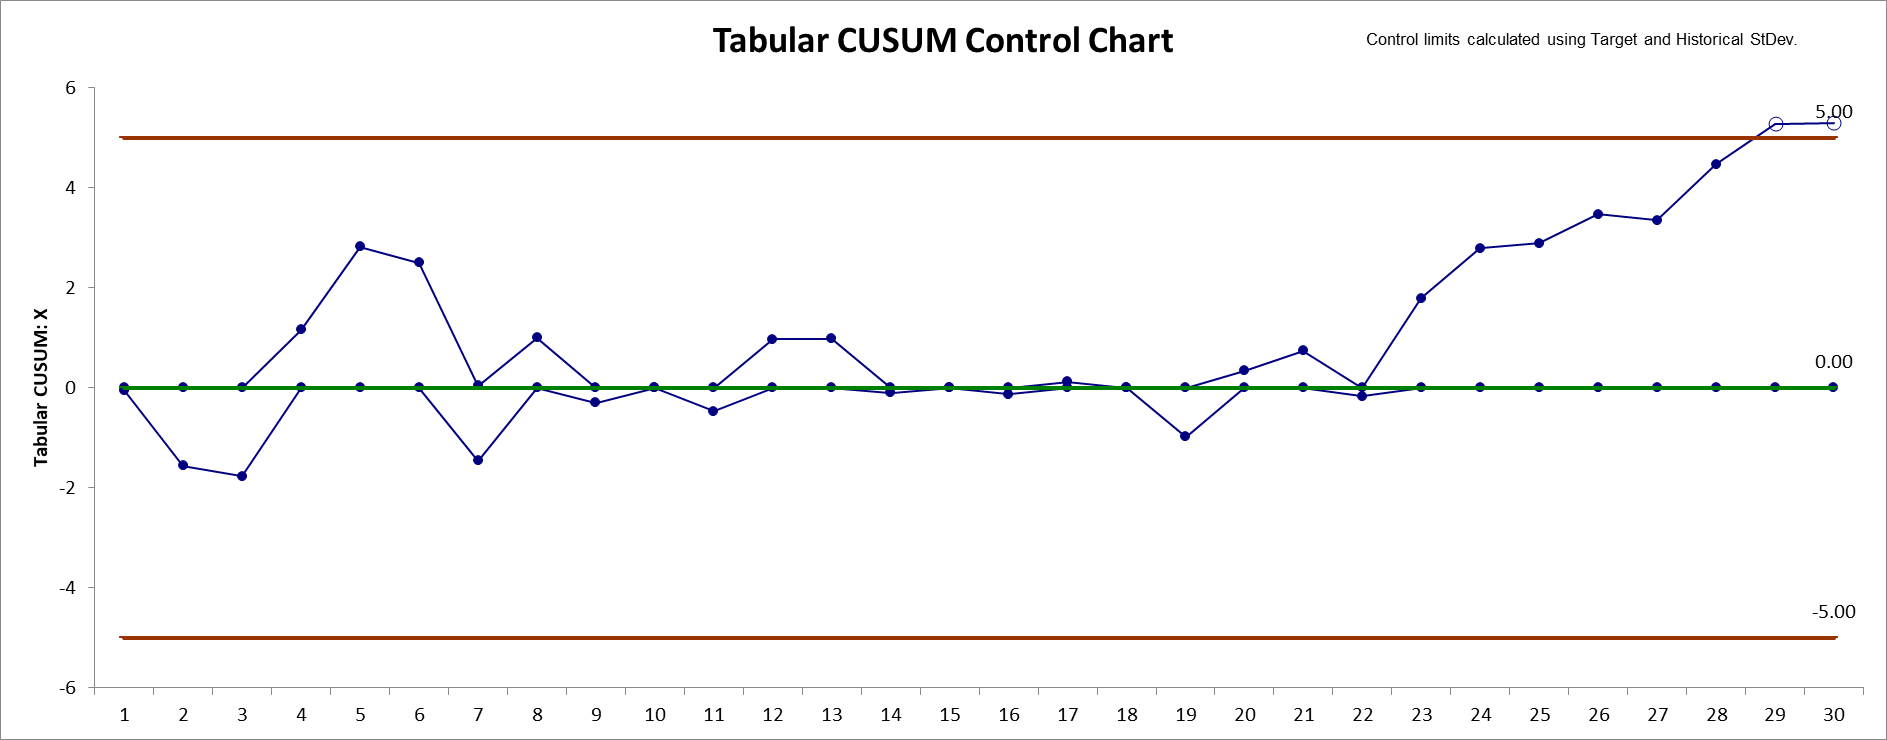
The CUSUM chart plots the cumulative sums of deviations of sample values from a target value. Because they combine information from several samples, cumulative sum charts are more effective than Shewhart charts for detecting small process shifts. There are two ways to represent CUSUMs: the tabular (or algorithmic) CUSUM, and the V-mask form of the CUSUM (see Montgomery, 2013). SigmaXL utilizes the Tabular CUSUM.
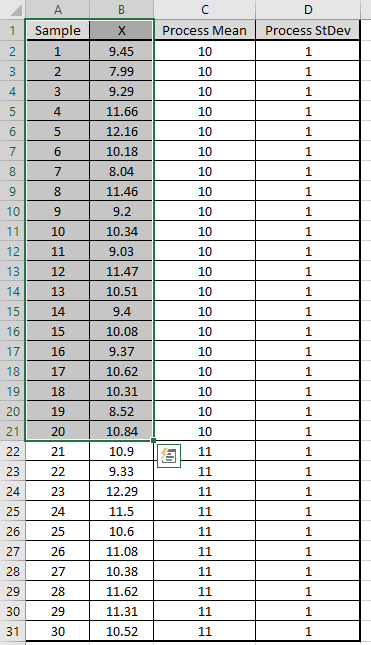
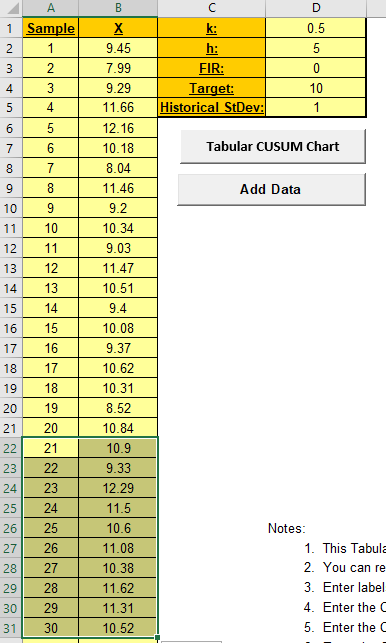
1. This Tabular Cumulative Sum (CUSUM) Control Chart template should be used with continuous data. The data must be in chronological time-sequence order.
2. You can replace the X-Axis Label and Data column headings with any headings that you wish. Enter your data in the Data column.
3. Enter labels in the X-Axis Label column. Labels can be Date, Time, Name, or other text information. These labels are optional and will appear on the horizontal X-Axis of the Tabular CUSUM Control Chart.
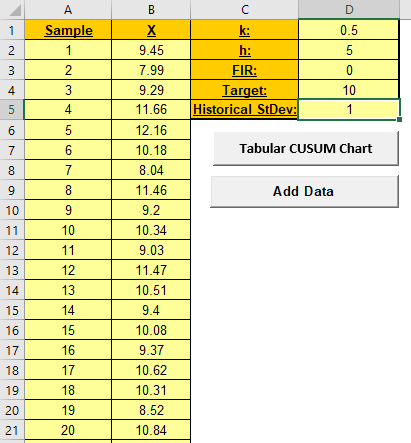
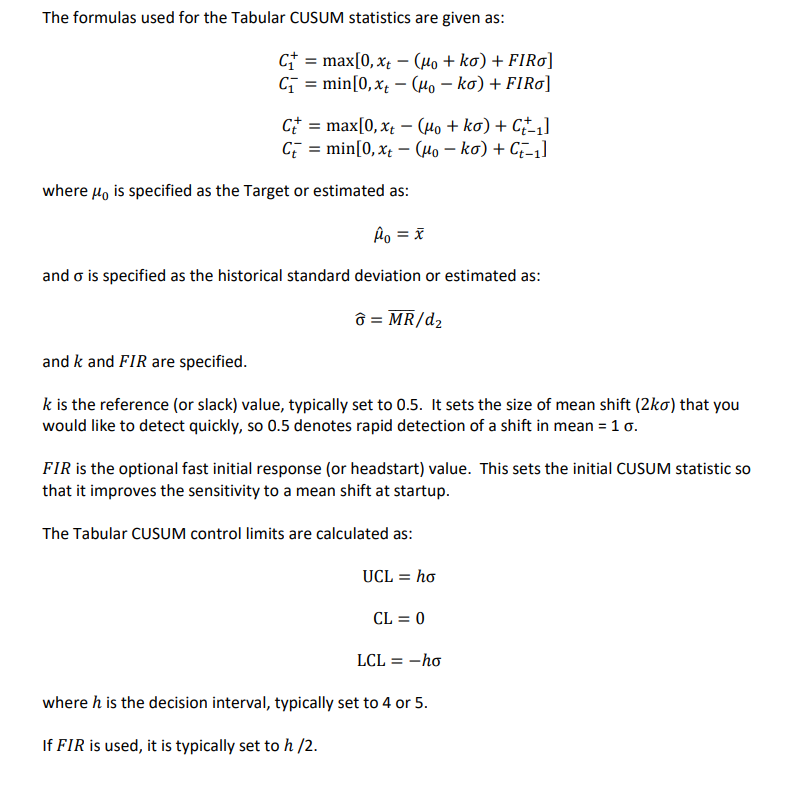
4. Enter the CUSUM k parameter in cell D1. This is the reference (or slack) value, typically set to 0.5. It sets the size of mean shift (2k sigma) that you would like to detect quickly, so 0.5 denotes rapid detection of a shift in mean = 1 sigma.
5. Enter the CUSUM h parameter in cell D2. This is the decision interval, typically set to 4 or 5. The upper and lower control limits = +/- h*StDev (MR-bar/d2). The center line = 0.
6. Enter the CUSUM FIR parameter in cell D3. This is the fast initial response (or headstart) value, typically set to h/2 if used, 0 otherwise. This sets the initial CUSUM statistic so that it improves the sensitivity to a mean shift at startup.
7. Optionally enter the CUSUM Target in cell D4. This is your process target value, typically the midpoint of your specification limits or historical mean. If you do not specify a Target, the data average will be used.
8. Optionally enter the CUSUM Historical StDev in cell D5. If you do not specify a Historical StDev, it will be estimated using MR-bar/d2.
9. The h, k and FIR parameters affect the Average Run Length (ARL) characteristics. For example, h=4 will detect a small shift more quickly than h=5, but has a shorter ARL(0) run length (higher false alarm rate).
10. To determine optimal CUSUM parameter values and calculate ARL, click SigmaXL > Templates and Calculators > Control Chart Templates > Average Run Length (ARL) Calculators > CUSUM ARL.
Click the Tabular CUSUM Chart button to create a Tabular CUSUM Control Chart.
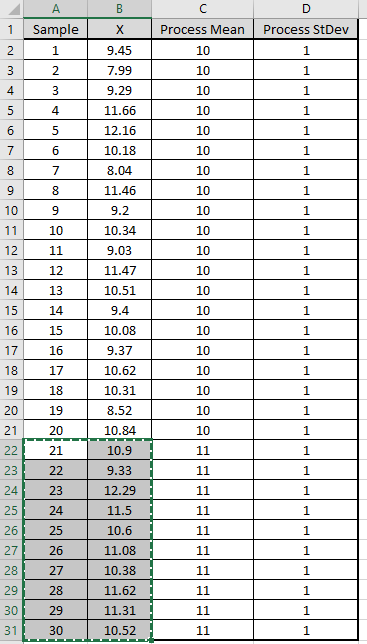
12. After the control chart has been created and additional new data entered into the Data column, click the Add Data button to add the data to the existing chart. Control limits will be calculated using the original chart mean and stdev or specified Target and Historical StDev.
13. Add Data should only be used if there are at least 20 observations in the original chart, or Target and Historical StDev have been specified.
14. The k , h and FIR parameters are dynamic. If they are modified, the chart will automatically update with the new parameters. However, they should be selected prior to creating the Tabular CUSUM chart. Data values and out-of-control formatting are refreshed only when the buttons are used.
15. Reference: Montgomery, D.C. (2013), Introduction to Statistical Quality Control, Seventh Ed., Wiley, pp. 418-427.


