Click SigmaXL > Templates & Calculators > Control
Chart Templates > Average Run Length (ARL)
Calculators> Shewhart ARL. This template is also
located at SigmaXL > Control Charts > Control
Chart Templates> Average Run Length (ARL)
Calculators > Shewhart ARL.
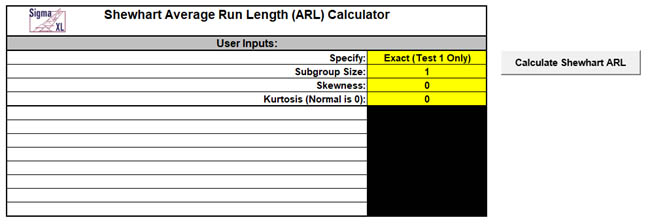
The default template settings are Specify =
Exact (Test 1 Only), Subgroup Size = 1,
Skewness = 0, Kurtosis (Normal is 0) = 0.
Notes: Specify Exact (Test 1 Only) or
Monte Carlo using the drop-down list. Parameters to
be specified will be shown in yellow highlight,
otherwise they are hidden. Exact uses the normal or
Pearson cumulative distribution function and is
fast. Monte Carlo simulation allows you to assess
the ARL performance of all 8 Tests for Special
Causes. Test 1 - 1 point more than 3 standard
deviations from the center line (CL) is always
applied. Monte Carlo simulation also produces the
table of Run Length Standard Deviation and
Percentiles (scroll right to view). Both methods
allow you to assess robustness to nonnormality.
All ARL calculations for Shewhart use a
standardized in-control mean=0 and sigma=1.
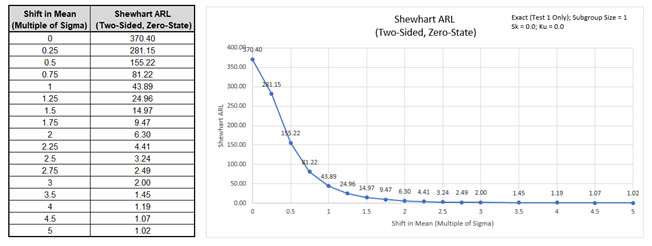
Click the Calculate Shewhart ARL button to
reproduce the ARL table and chart.
As discussed in the introduction, the
ARL0 (in-control ARL with 0 shift in mean) for the
Shewhart chart is 370.4. The ARL1 for a small 1
sigma shift in mean is 43.89, so is slow to detect.
On the other hand, a large 3 sigma shift in mean has
an ARL = 2.0, so is detected rapidly.
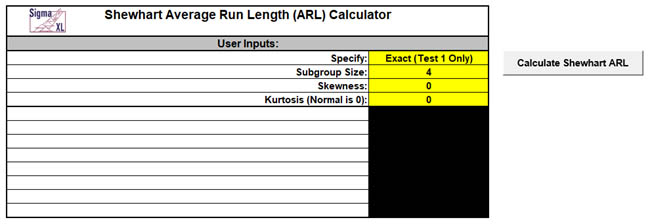
We will now assess ARL for a Shewhart X-bar chart.
Select Specify = Exact (Test 1 Only). Enter
Subgroup Size = 4, Skewness = 0,
Kurtosis (Normal is 0) = 0.
Click the Calculate Shewhart ARL button to
produce the ARL table and chart for these settings:
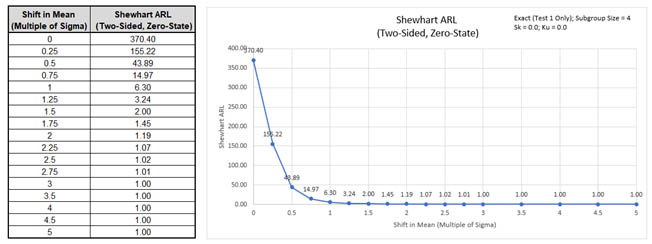
The ARL0 for the Shewhart x-bar chart is the
same as the Individuals chart, 370.4. The ARL1 for a
small 1 sigma shift in mean is 6.3, so is much more
rapid to detect than the Individuals ARL1 of 43.89, so
if possible, subgrouping should always be used.
Note: The ARL for subgroup
averages is adjusted by using the sigma of averages,
sigma/√n. For example, with a subgroup size of 4,
the ARL1 values at shift in mean = 1 will match the
ARL performance of an Individuals chart with shift
in mean = 2 sigma.
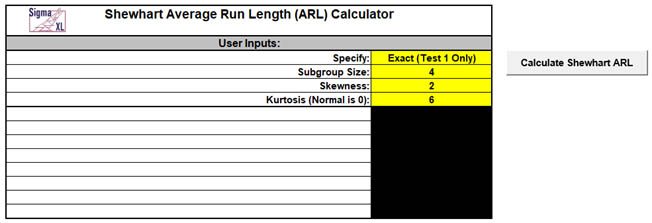
Now we will assess robustness to nonnormality. Enter
Specify = Exact (Test 1 Only), Subgroup Size
= 1, Skewness = 2, Kurtosis (Normal is 0)
= 6.
Note: We are specifying a severe degree
of Skewness (Skewness = 0.5 is mild, 1 is moderate,
2 is severe, and > 2 is very severe). The Pearson
family is used to create a distribution that matches
the specified Skewness and Kurtosis. Skewness = 2
and Kurtosis = 6 corresponds to an Exponential
distribution or Gamma distribution with Shape= 1 and
Scale= 1 (for Gamma, Skewness = 2/√Shape
and Kurtosis = 6/Shape).
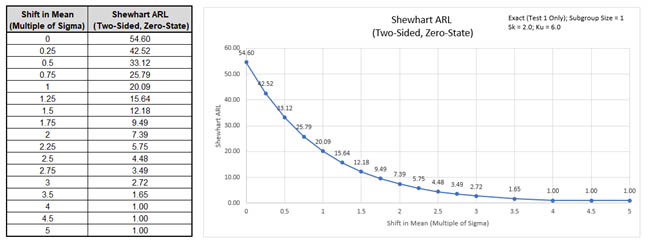
Click the Calculate Shewhart ARL button to produce the ARL
table and chart for these settings:
ARL0 with these settings is 54.6. This is a
very poor performance with a 6.8 x increase
(370.4/54.6) in false alarms compared to normal
data. The Shewhart Individuals chart is not robust
to severe skewness. A Box-Cox Transformation or
other Individuals Nonnormal chart should be used
(see SigmaXL > Control Charts > Nonnormal >
Individuals Nonnormal).
Note: ARL0= 54.6 matches the
result given in Montgomery [2], Table 9.12 for
Gam(1,1).
Next, we will assess robustness to nonnormality for a Shewhart X-bar chart. Enter Specify =
Exact (Test 1 Only), Subgroup Size = 4, Skewness
= 2, Kurtosis (Normal is 0) = 6.
Note: Skewness of averages
= Skewness/√n.
Kurtosis of averages = Kurtosis/n. For a subgroup
size of 4, the skewness of averages is 1, so is
reduced from severe to moderate. Kurtosis of
averages is 1.5 (corresponding to a Gamma
distribution with Shape = 4).
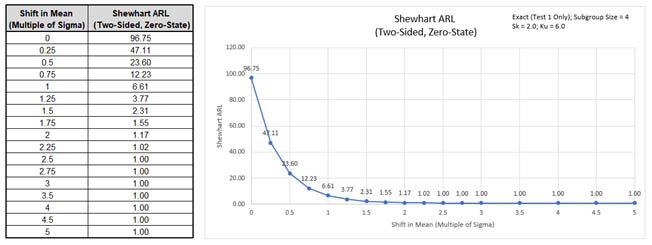
Click the Calculate Shewhart ARL button to
produce the ARL table and chart for these settings:
ARL0 with these settings is 96.75. This is an
improvement over the Individuals 54.6, but is still
a 3.8 x increase (370.4/96.75) in false alarms
compared to normal data.
Note: ARL0 = 96.75 matches the
results given in Schilling & Nelson [3] (Table 1,
Gamma, shape = 1, n=4), =1/.01034. In Table 2, they
point out that a subgroup size of 166 would be
required to achieve robustness for this severe
skewness.
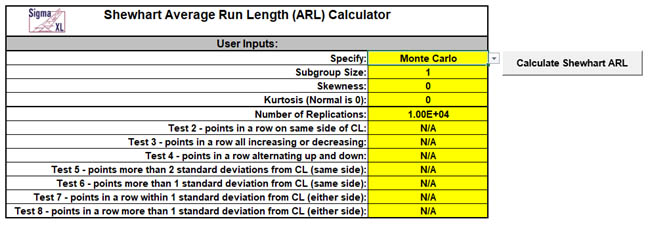
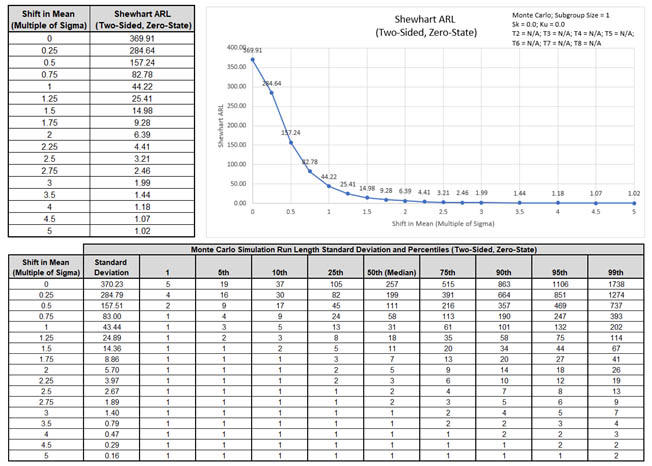
Now we will use Monte Carlo simulation to obtain
approximate Run Length standard deviation and
percentiles for an Individuals Shewhart chart with
normal data. Enter Specify = Monte Carlo,
Subgroup Size = 1, Skewness = 0,
Kurtosis (Normal is 0) = 0, Number of
Replications = 1e4, and Test 2 to Test
8 = N/A.
Click the Calculate Shewhart ARL button to
produce the Monte Carlo approximate ARL table, ARL
chart and Run Length Standard Deviation and
Percentiles table (scroll right to view). Monte
Carlo simulation with 10,000 (1e4) replications will
take about a minute to run.
The additional run length statistics show the
large variation of run length values. The median
MRL0 = 257 (in-control median run length with 0
shift in process mean). The run length percentiles
approximately match those given in Chakraborti [4]
(Table 1, Standards Known, Shift 0.0).
Note: The results will vary slightly
since this is Monte Carlo simulation.
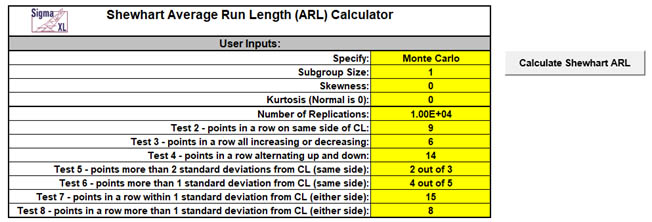
Now we will use Monte Carlo simulation to assess the
Shewhart Individuals chart with all 8 Tests for
Special Causes applied. Enter Specify = Monte
Carlo, Subgroup Size = 1, Skewness =
0, Kurtosis (Normal is 0) = 0, Number of
Replications = 1e4, Test 2 = 9, Test 3
= 6, Test 4 = 14, Test 5 = 2 out of 3,
Test 6 = 4 out of 5, Test 7 = 15 and
Test 8 = 8.
Note: These are the test settings
used as defaults in SigmaXL > Control Charts >
Tests for Special Causes Defaults. Test 1 is
always applied.
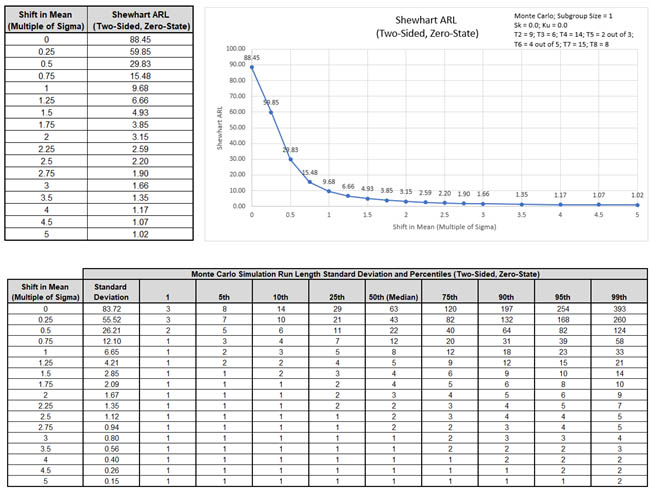
Click the Calculate Shewhart ARL button to
produce the Monte Carlo approximate ARL table, ARL
chart and Run Length Standard Deviation and
Percentiles table.
ARL0 with all 8 tests for special causes is
approx. 88.5. This is a poor performance with a 4.2
x increase (370.4/88.5) in false alarms compared to
Test 1 only. MRL0 is approx. 63. On the other hand,
ARL1 for a small 1 sigma shift in mean is approx.
9.7, so is much faster to detect than the Exact Test
1 only ARL1 of 43.89.
If small shifts are to be detected
quickly and subgrouping is not possible, then an
EWMA or CUSUM chart is recommended.
Template Notes:
Specify Exact (Test 1 Only) or Monte Carlo
using the drop-down list. Parameters to be specified
will be shown in yellow highlight, otherwise they are
hidden.
Exact uses the cumulative distribution function and
is fast. Monte Carlo simulation allows you to assess the
ARL performance of all 8 Tests for Special Causes and
also produces the table of Run Length Standard Deviation
and Percentiles (scroll right to view). Both methods
allow you to assess robustness to nonnormality.
Test 1 - 1 point more than 3 standard deviations
from the center line (CL) is always applied.
The Pearson Family of distributions is used to match
the specified Skewness and Kurtosis.
Enter the Subgroup Size. Subgroup size = 1
denotes a Shewhart Individuals chart. Subgroup size > 1
is an X-Bar chart.
Enter Skewness. Skewness = 0 is symmetric.
Enter Kurtosis (Normal is 0). Also known as
Excess Kurtosis, it must be >= Skewness^2 - 1.48. This
is required to keep the distribution unimodal. If
Skewness=0 and Kurtosis = 0, the distribution is normal.
If applicable, enter Number of Replications.
1000 (1e3) replications will be fast, approx. 10
seconds, but will have an ARL0 error approx. = +/- 10%;
10,000 (1e4) replications will take about a minute, with
an ARL0 error = +/- 3.2%; 100,000 (1e5) replications
will take about ten minutes, with an ARL0 error = +/-
1%.
If applicable, select values for Tests 2 to 8 using
the drop-down list. "N/A" indicates that the test is not
applied. Tests 2, 3 and 7 provide options that match
those provided in SigmaXL's 'Tests for Special
Causes' Defaults dialog.
Click the Calculate Shewhart ARL button to
produce the ARL table and chart. If Monte Carlo was
selected, the table of Run Length Standard Deviation and
Percentiles will also be produced.
The Shewhart ARL is for a two-sided chart with
zero-state, i.e., the shift is assumed to occur at the
start. The mean and standard deviation are also assumed
to be known. This will not likely be the case in use,
but is still useful for determining parameter settings
and comparison of ARL across chart types.
Due to the complexity of calculations, SigmaXL
must be loaded and appear on the menu in order for this
template to function. Do not add or delete rows or
columns in this template.
REFERENCES:
Champ, C.W. and Woodall, W.H. (1987), "Exact results
for Shewhart control charts with supplementary runs
rules", Technometrics 29, 393-399.
Schilling, E. G., and P. R. Nelson (1976), The
Effect of Nonnormality on the Control Limits of X ̅
Charts,Journal of Quality Technology, Vol. 8(4), pp.
183188.
Chakraborti, S. (2007), Run Length Distribution and
Percentiles: The Shewhart Chart with Unknown
Parameters, Quality Engineering 19, 119127.