Include Top

Control Chart Templates: Rare Events


  1. Click SigmaXL > Templates & Calculators > Control Chart Templates > Rare Events > Rare Events T. This template is also located at SigmaXL > Control Charts > Control Chart Templates > Rare Events > Rare Events T.

  2. Open Days Between Surgical Site Infections.xlsx (Sheet 1 tab). Days between surgical site infections are an important health care metric. Since they are rare events, days between (or time between) events are tracked rather than events per day. The event date/times 1/1/2019 to 6/13/2019 are “Before Improvement” and the days between will be used to calculate the control limits. Date/times 6/14/2019 to 2/26/2020 are “After Improvement” and the days between will be added to the control chart. The goal is to decrease the occurrence of Surgical Site Infections which will increase the days between, with an “out-of-control” signal above the UCL being desirable and confirmation of the improvement effort.

    RARETSTEP2
  3. Copy the “Before Improvement” date/times in cells A1:A22 and Paste Values to the template at A1. Days Between are automatically calculated using the Excel formula =A3-A2, =A4-A3, etc. Cell B2 is not used.

    RARETSTEP3
  4. Click the Rare Events T Control Chart button to create the Rare Events T Control Chart:

    RARESTEP4
  5. This confirms that the process is “in-control”. As discussed above the control limits are asymmetrical.

  6. Although the process is “in-control”, as a critical health care metric, efforts were made to improve the process and this data will be now added to the chart. Switch back to Days Between Surgical Site Infections.xlsx (Sheet 1 tab). Select and copy the “After Improvement” date/times in cells A23: A32 as shown.

    RARETSTEP6
  7. Switch to the Rare Events T Control Chart template and Paste Values to cell A23 as shown.

    RARETSTEP7
  8. Click the Add Data button to add the new Days Between data to the Rare Events T Control Chart:

    RARESTEP8

  9. This confirms that the process is now “out-of-control”, so the improvement efforts to decrease the occurrence of Surgical Site Infections and increase the Days Between have been successful. Note that the control limits should be recalculated with just the “After Improvement” data when 20 data points are available.

The Rare Events T Chart (or time-between chart) is an alternative to a standard attribute chart when the adverse event of interest is relatively rare and a measurement of time between each occurrence can be obtained. If the rate of occurrence follows a Poisson distribution (the usual assumption for a C or U chart), then the times between occurrences will have an exponential distribution. The exponential distribution can be transformed to a symmetric Weibull distribution by raising the time measure to the (1/3.6) power. A Shewhart Individuals chart is calculated on the transformed data and then an inverse transformation is applied to the control limits in order to get back to the original time between units. This is an approximate model to the exponential and will result in asymmetric control limits. Note that an "out-of-control" signal above the UCL is desirable, indicating a significant increase in time between adverse rare events:

Tip: Alternatively, a Rare Events T Chart may be created using an Exponential or Weibull Control Chart on the Days Between data. Click SigmaXL > Control Charts > Nonnormal > Individuals Nonnormal. Select Specify Distribution, Exponential (1 Parameter) or Weibull (2 Parameter). To select which distribution is the best fit, use distribution fitting: SigmaXL > Control Charts > Nonnormal > Distribution Fitting. Select All Transformations & Distributions and compare.

Template Notes and References:

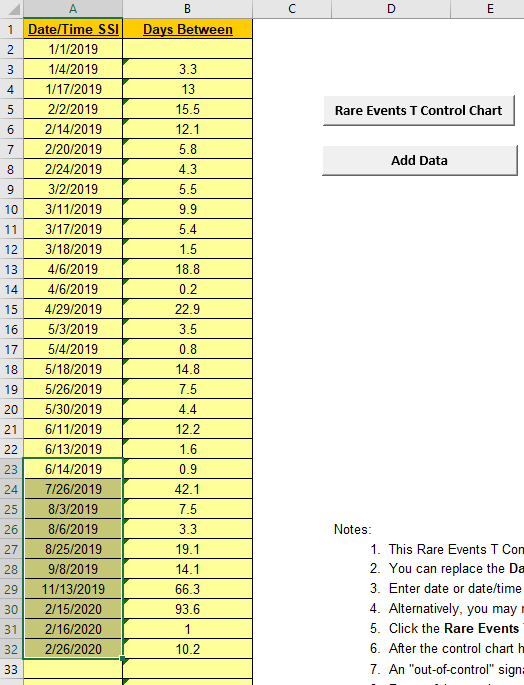
1. This Rare Events T Control Chart template should be used with days or time between (typically adverse) rare events.

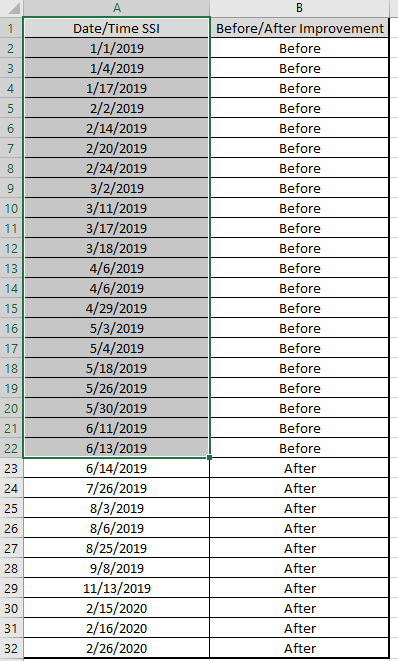
2. You can replace the Date/Time and Days Between column headings with any headings that you wish.

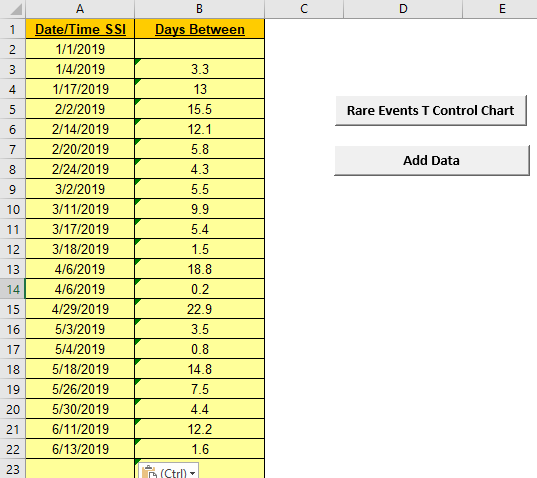
3. Enter date or date/time in the Date/Time column. Days between are automatically calculated and entered into Days Between column. Cell B2 is not used in this case.

4. Alternatively, you may manually enter data in Days Between. Note, this will overwrite the cell formula.

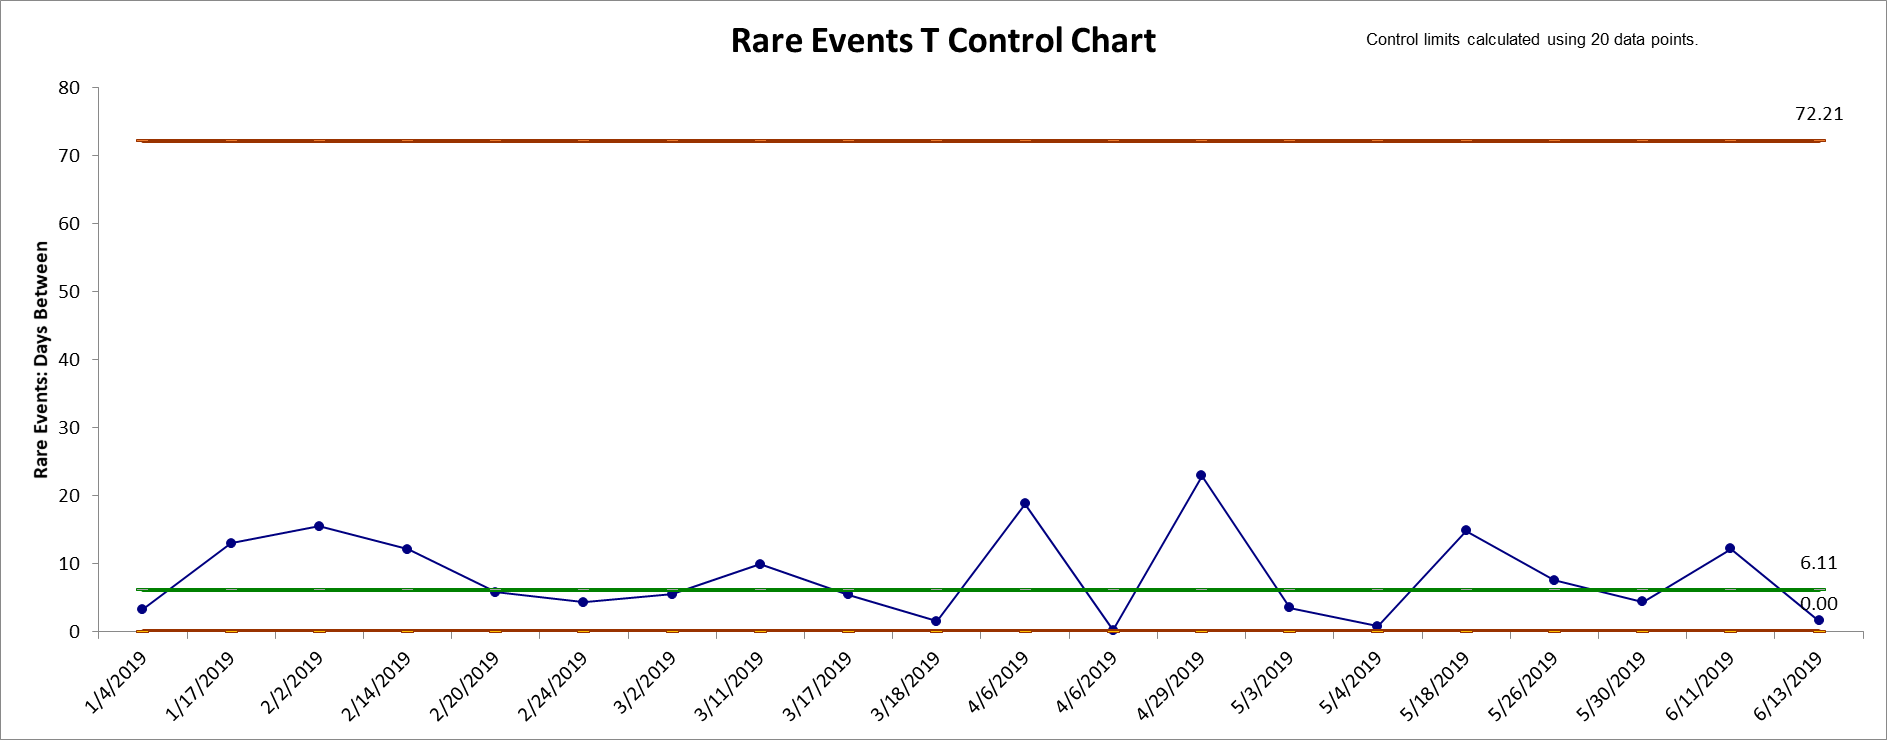
5. Click the Rare Events T Control Chart button to create a control chart. This will overwrite any existing control chart.

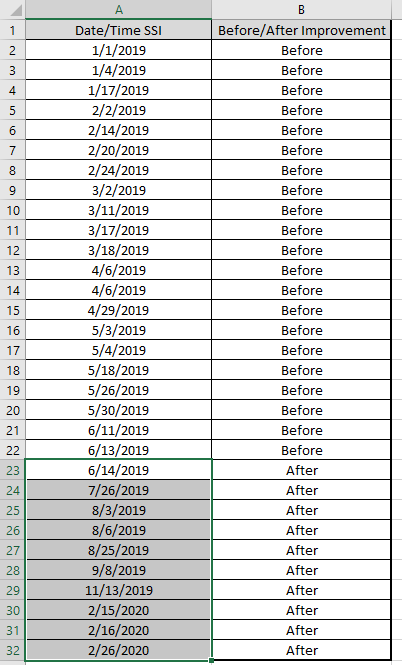
6. After the control chart has been created and additional new Date/Time or Days Between data entered, click the Add Data button to add the data to the existing chart.

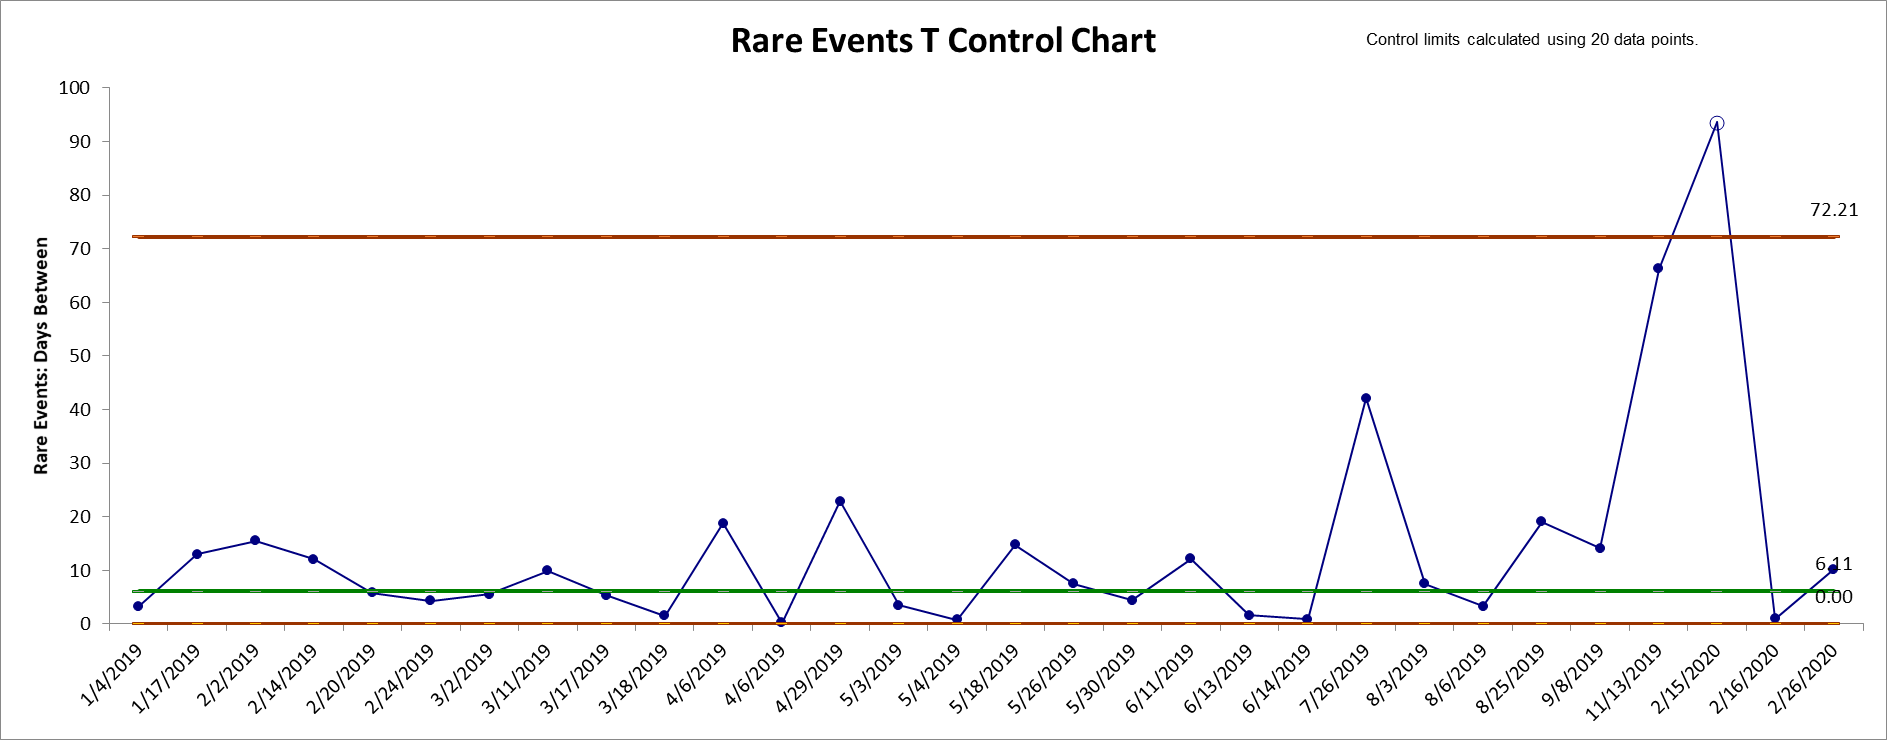
7. An "out-of-control" signal above the UCL is desirable, indicating a significant increase in time between adverse rare events.

8. Be careful to not have any zeros in the data.

9. This chart uses the control limit formulas given in Provost and Murray, 2011.

10. The data are transformed with Y^(1/3.6), which transforms an exponential distribution to a symmetric Weibull. See Nelson, 1994.

11. A Shewhart Individuals Chart is created on the transformed data and the final control limits are then calculated as UCL^3.6, CL^3.6, LCL^3.6.

12. Alternatively, a Rare Events T Chart may be created using a Weibull or Exponential Control Chart. Click SigmaXL > Control Charts > Nonnormal > Individuals Nonnormal. Select Specify Distribution, Exponential (1 Parameter) or Weibull (2 Parameter).

13. References: Nelson, L.S. (1994), “A Control Chart for Parts-Per-Million Nonconforming Items”, Journal of Quality Technology, 26:3, pp. 239-240. Provost L, Murray S. (2011), The Health Care Data Guide: Learning from Data for Improvement. San Francisco: Jossey-Bass, pp. 230-231.


Define, Measure, Analyze, Improve, Control

Lean Six Sigma Software Excel Add-in

Simulate, Optimize,
Realize

Lean Six Sigma Software Excel Add-in

Web Demos

Our CTO and Co-Founder, John Noguera, regularly hosts free Web Demos featuring SigmaXL and DiscoverSim
Click here to view some now!

Contact Us

Phone: 1.888.SigmaXL (744.6295)

Support: Support@SigmaXL.com

Sales: Sales@SigmaXL.com

Information: Information@SigmaXL.com