Multiple X Boxplots allow you to create boxplots with one Y variable and multiple group
category Xs. A row of boxplots will be created, one for each X variable. This is useful for
easy comparison of the effect of each category X.
Click Sheet 1 Tab of Customer
Data.xlsx (or press F4 to activate
last worksheet).
Click SigmaXL > Graphical Tools > Multiple X
Boxplots.
Ensure that entire data table is selected. If not, check
Use Entire Data Table.
Click Next.
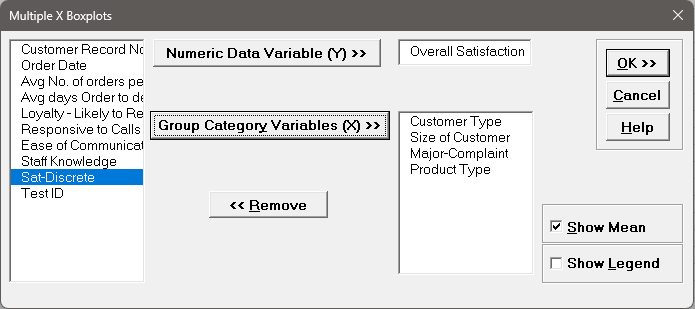
Select Overall Satisfaction, click Numeric Data Variable (Y)
>>.
Select Customer Type, Size of Customer, Major-Complaint, and Product
Type.
Click Group Category Variables (X) >>.
Check Show Mean, uncheck Show Legend:
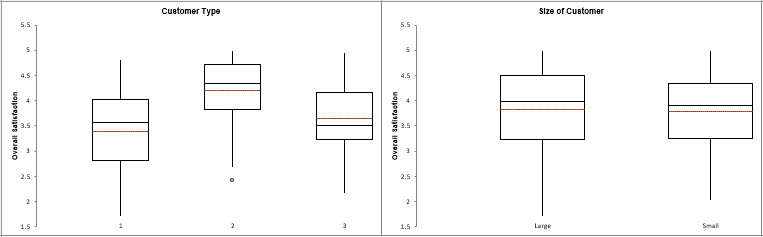
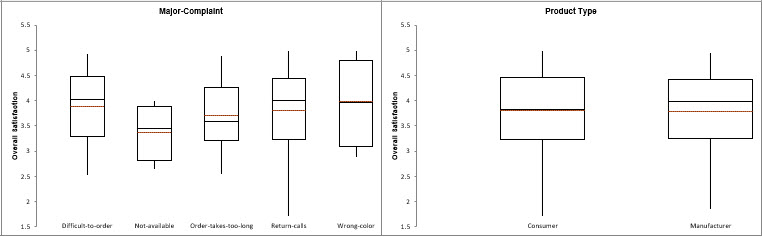
Click OK. The boxplots showing Overall Satisfaction by Customer Type,
Size of Customer, Major-Complaint and Product Type are produced in a row (note that this
will take about one minute):