Mood's Median Test - Exact
This tool is used to compute exact P-Values. Typically this would not be necessary unless the
sample sizes were smaller (each sample N <= 10 for Moods Median), but this gives continuity
on the example. Unlike Kruskal-Wallis, computing an exact P-Value is efficient due to
the reduction of the data to a Chi-Square table and the use of a Network Model (see
Appendix Exact and Monte Carlo P-Values for Nonparametric and Contingency Tests)
- Open Customer Data.xlsx, click on Sheet 1 tab
(or press
F4 to activate last worksheet).
- Click SigmaXL > Statistical Tools > Nonparametric Tests -
Exact> Moods Median Test
- Exact. If necessary, check
Use Entire Data Table. click Next.
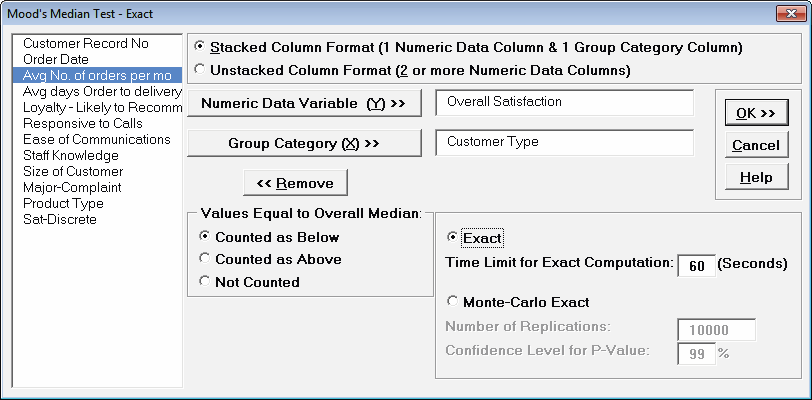
- With Stacked Column Format checked, select Overall
Satisfaction, click Numeric Data Variable (Y)
>>;
select Customer Type, click Group Category (X)
>>.
Select Exact with the default Time Limit for Exact
Computation = 60 seconds. Set Values Equal to Overall
Median: to Counted as Below.
Tip: If none of the observations are equal to the overall median,
the options for Values Equal to Overall Median: do not
affect the exact P-Value. That is the case with this Customer Data example.
In cases where there are observations equal to the overall median, then the
exact P-Value will be different for each option selected. For regular Moods
Median, SigmaXL uses Counted as Below (in agreement with
Minitab) but will use Counted as Above for small sample
cases if the average cell expected value is higher. StatXact uses
Counted as Below for Moods Median. Matlab uses Not
Counted.
Users should try Counted as Below and Counted as
Above to ensure that the P-Values agree on reject or fail to reject
H0. Use of this option will be demonstrated in the small sample example.
Tip: If the exact computation time limit is exceeded a
dialog will prompt you to use Monte Carlo or to increase the computation
time. When this occurs, Monte Carlo is recommended.
- Click OK.
Resulting Output:
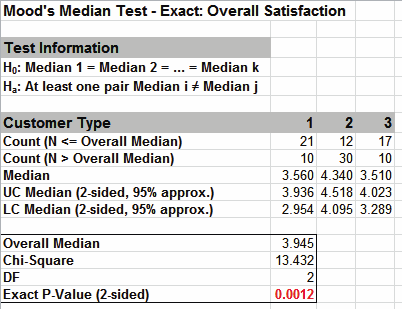
Click on cell B17 to view the Exact P-Value
with more decimal place precision. Given the P-Value of .00124 we
reject H0 and conclude that at least one pairwise set of medians
are not equal. The Exact P-Value is very close to the above
large sample or asymptotic result (.00121). This was
expected because the sample size is reasonable (N > 10), so the
large sample Moods Median P-Values are valid using a
chi-square approximation. Note also that the counts in
B8:D9 form a two way contingency table and the expected
counts are all greater than 5.
The Exact P-Value was computed in seconds, but if the data set
was larger, the required computation time could become
excessive, and Monte Carlo would be required.
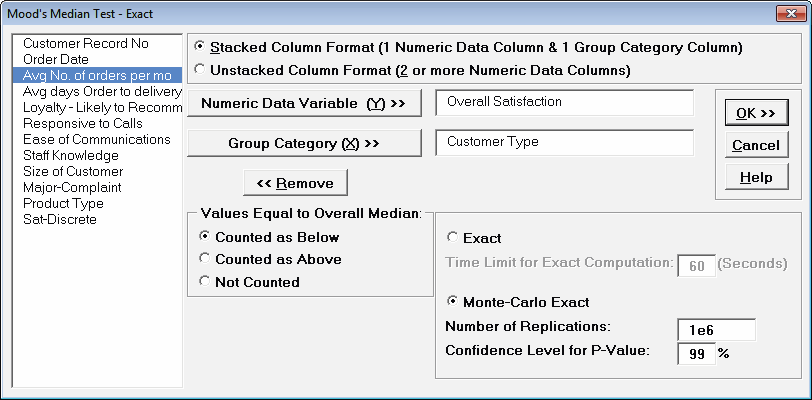
- Press
F3 or click Recall SigmaXL Dialog to
Recall Last Dialog. Select Monte Carlo Exact
with the Number of Replications = 1e6 and
Confidence Level for P-Value = 99%. One million
replications are used because the expected P-Value is small as
estimated from the large sample Moods Median above. This will
take up to a minute to run, so if you have a slow computer, use
1e5 replications instead of 1e6.
Tip: The Monte Carlo 99% confidence interval
for P-Value is not the same as a confidence
interval on the test statistic due to data sampling error. The
confidence level for the hypothesis test statistic is still 95%,
so all reported P-Values less than .05 will be
highlighted in red to indicate significance. The 99%
Monte Carlo P-Value confidence interval is due to the
uncertainty in Monte Carlo sampling, and it becomes smaller as
the number of replications increases (irrespective of the data
sample size). The Exact P-Value will lie within the stated Monte
Carlo confidence interval 99% of the time.
- Click OK.
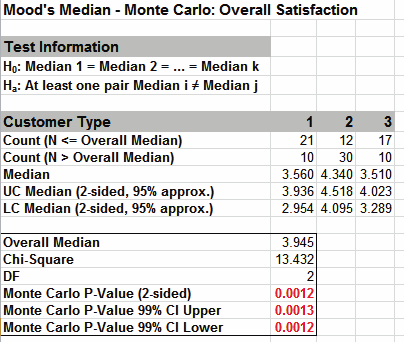
Click on cell B17 to view the Monte
Carlo P-Value with more decimal place precision. The Monte Carlo
P-Value here is .001249 with a 99% confidence interval of .00117
(B19) to .00133 (B18). This
will be slightly different every time it is run (the Monte Carlo
seed value is derived from the system clock). The true Exact
P-Value = .00124 lies within this confidence interval.
So we reject H0: at least one pairwise set of medians are not
equal.
- Now we will consider the small sample problem used in
Kruskal-Wallis. Open Snore Study.xlsx. This
data is from: Gibbons, J.D. and Chakraborti, S. (2010). Nonparametric
Statistical Inference (5th Edition). New York: Chapman & Hall,
(Example 10.2.1, pp. 347-348).
An experiment was conducted to determine which device is the
most effective in stopping snoring or at least in reducing it.
Fifteen men who are habitual snorers were divided randomly into
three groups to test the devices. Each mans sleep was monitored
for one night by a machine that measures the amount of snoring on a
100-point scale while using a device.
- Select Snore Study Data tab. Click
SigmaXL > Statistical Tools > Nonparametric Tests Exact >
Moods Median Test - Exact. If necessary, check
Use Entire Data Table, click Next.
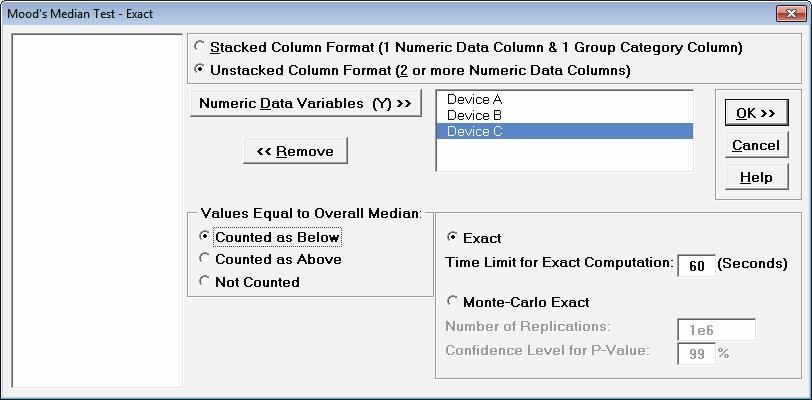
- With Unstacked Column Format checked,
select Device A, Device B and Device C, click
Numeric Data Variables (Y) >>. Select Exact
with the default Time Limit for Exact Computation
= 60 seconds.
- Click OK. Results:
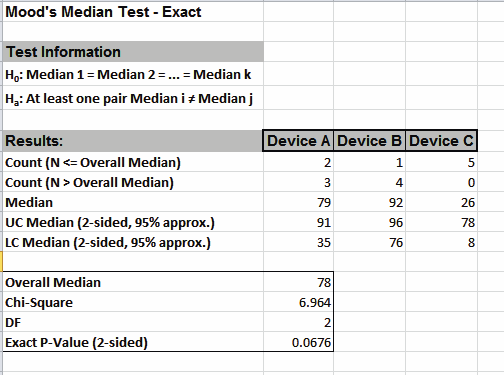
With the Exact P-Value = .0676 we fail to reject H0, and cannot
conclude that there is a significant difference in median snore
study scores. This exact P-Value matches that given in the
reference textbook using StatXact. Comparing Moods Median to
Kruskal-Wallis we see that the Exact P-Value is higher because
Moods Median is not as powerful as Kruskal-Wallis.
We will now rerun the analysis using the Counted as
Above option.
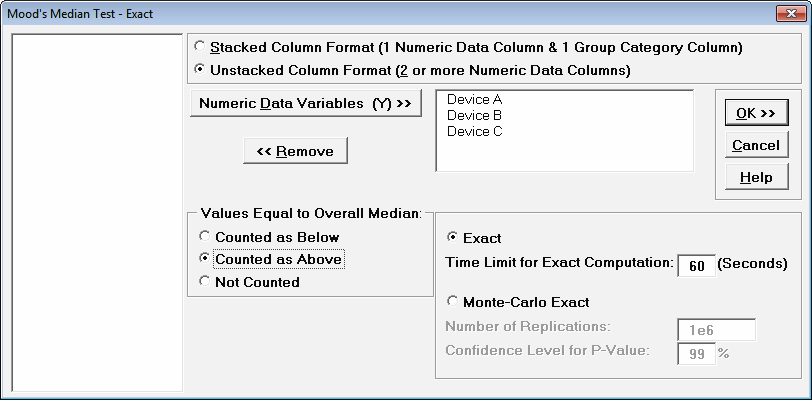
- Press F3 or click Recall SigmaXL
Dialog to Recall Last Dialog. Set Values Equal
to Overall Median: to Counted as Above.
- Click OK. Results:
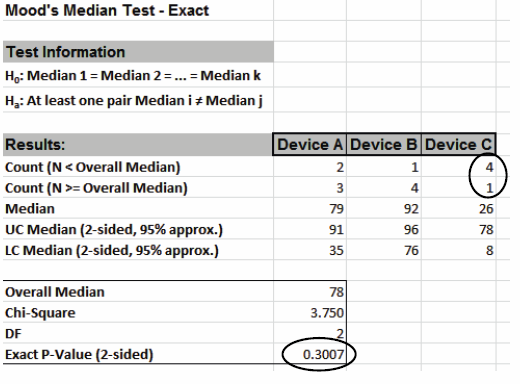
With the Exact P-Value = 0.3007 we fail to reject H0, and cannot
conclude that there is a significant difference in median snore
study scores. Note that setting Values Equal to Overall Median
to Counted as Above resulted in a different count for Device C,
which results in the dramatic difference in Exact P-Value.
In conclusion, when using Moods Median Exact, always try
Counted as Below and Counted as Above to ensure that the
P-Values agree with each other.


