How Do I Create I-MR-R/S Control Charts in Excel Using SigmaXL?
I-MR-R Charts
If the within-subgroup variability is much smaller than between subgroup, the classical X-bar & R (or S) chart will not work, producing numerous (false) alarms. The correct chart to use, in this case, is the I-MR-R (or S) chart. The subgroup averages are treated as individual values (I-MR) and the within subgroup ranges are plotted on the Range chart.
- Open Multi-Vari Data.xlsx. Select Sheet
Between. First, we will incorrectly use the X-bar & R chart, and then apply the correct I-MR-R chart.
- Click SigmaXL > Control Charts > X-bar & R. Check
Use Entire Data Table.
- Click Next. Select
Stacked Column Format. Select Measurement, click
Numeric Data Variable (Y) >>; select unit, click
Subgroup Column or Size >>.
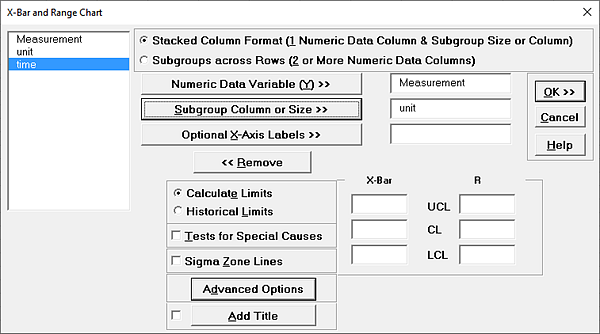
- Click OK. Resulting X-bar & R chart:
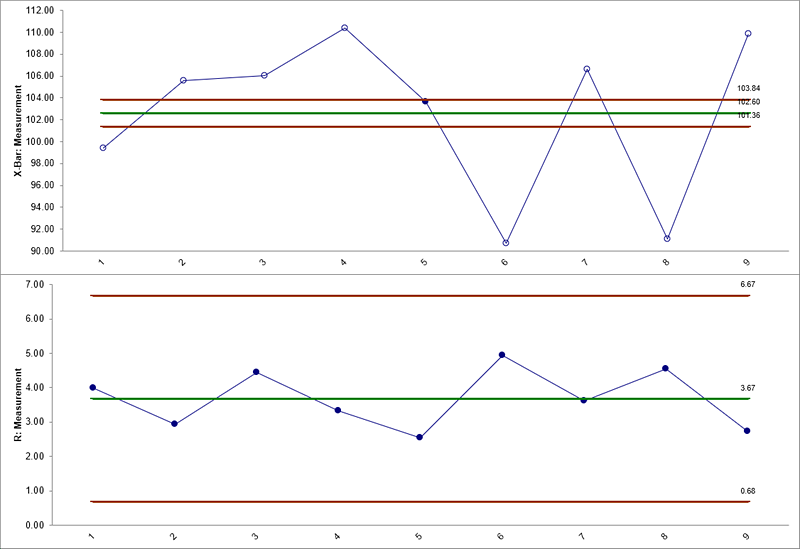
Almost all of the data points in the X-bar chart are out-of-control! This is due to the small within-subgroup variability (the control limits are calculated from the within-subgroup variability).
- Click Sheet
Between. Select SigmaXL > Control Charts > Advanced Charts > I-MR-R.
- Click Next.
Select Stacked Column Format.
Select Measurement, click Numeric Data Variable (Y) >>; select unit, click Subgroup Column or Size >>.
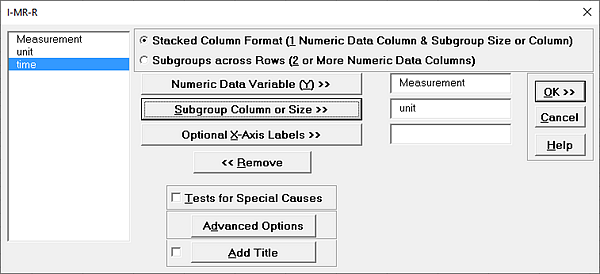
- Click OK.
Resulting I-MR-R chart:
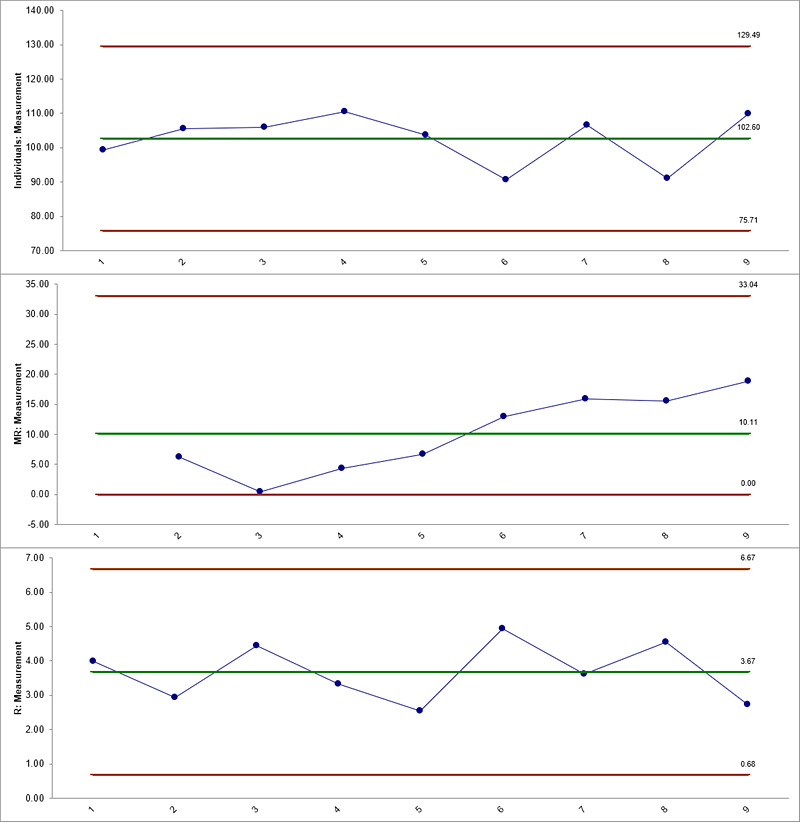
This chart is much cleaner, showing a stable Individuals and Range chart. The MR chart may be trending up, but we would want to collect more data before making this conclusion.
Typically, you want at least 20 (30 preferred) subgroups before calculating final control limits.


