How to Create Histograms with Descriptive Statistics in SigmaXL
SigmaXL's Histograms & Descriptive Statistics tool (found under SigmaXL > Graphical Tools) lets you quickly visualize data distributions, detect skewness, and compare groups — all within Microsoft Excel. Follow the steps below to generate multiple histograms grouped by a category variable.
Ensure that entire data table is selected. If not, check Use Entire Data Table. Click Next.
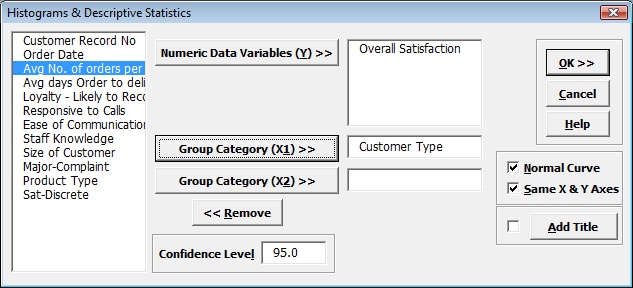
Select Overall Satisfaction, click
Numeric Data Variables (Y)
>>, select Customer Type, click Group Category (X1)
>> as shown:
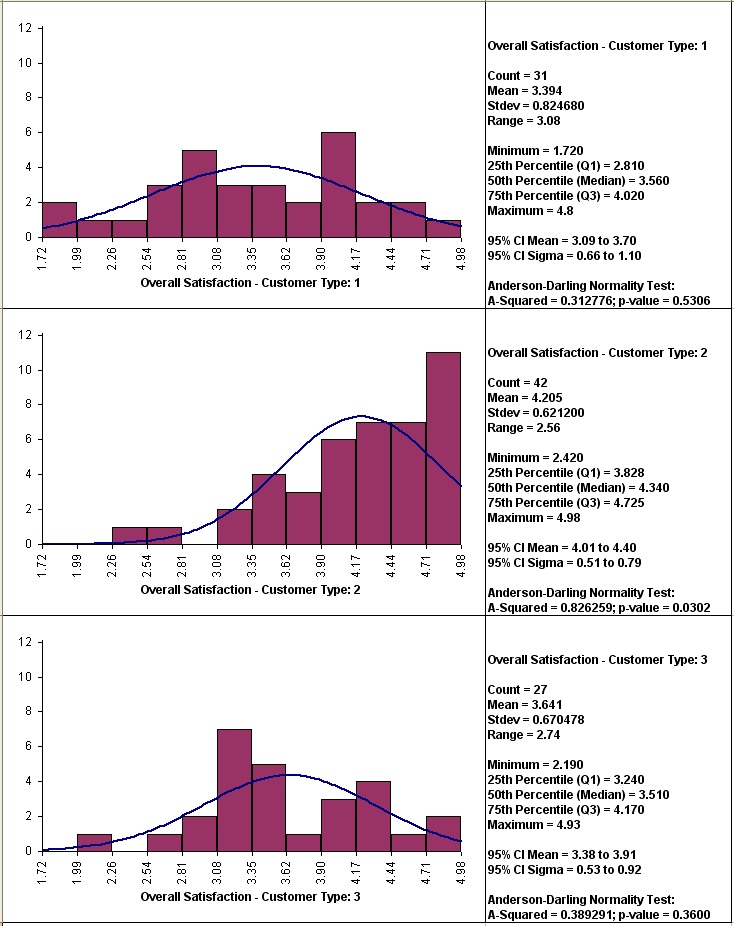
Click OK. Multiple Histograms and Descriptive Statistics of Customer Satisfaction By Customer Type are produced:
Clearly Customer Type 2 shows a higher level of overall satisfaction, with the data skewed left. Note that Customer Type 1 and 3 have data that is normally distributed, but this is not desirable when the response is a satisfaction score!
Note that bin one is 1.72 to < 1.99, bin 2 is 1.99 to < 2.26, etc. The number of decimals displayed can be changed by double-clicking on the X axis, click Number tab, and adjust decimal places.