Graphical Tool Selection Guide
- Home /
- Graphical Tool Selection Guide

Click SigmaXL > Graphical Tools > Graphical Tool Selection Guide to start the guide. Please have the data that you wish to analyze as the active sheet with data preselected or ready for selection. Select Data Type as Continuous or Attribute/Discrete. Select Purpose of Graph and then choose from the available graphical tools. Click OK >> to start the data selection and creation of the graph. Note that this is equivalent to selecting a graphical tool from the menu.
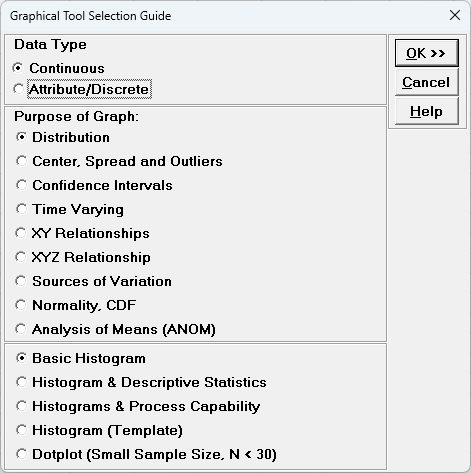
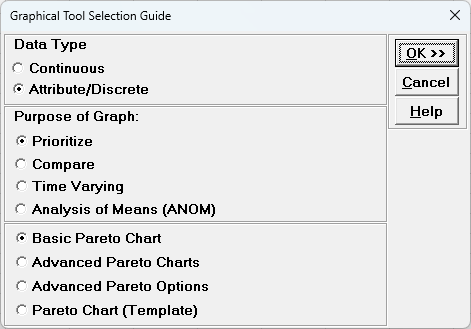
This guide helps users select the appropriate graphical tool for their data, including histograms, pareto, dotplots, box plots, scatter plots, XYZ Contour/Surface plots, and more.