Graphical Templates
Pareto Chart Example
Click SigmaXL > Templates & Calculators > Basic Graphical Templates > Pareto Chart. Enter data as shown: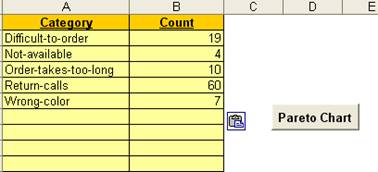
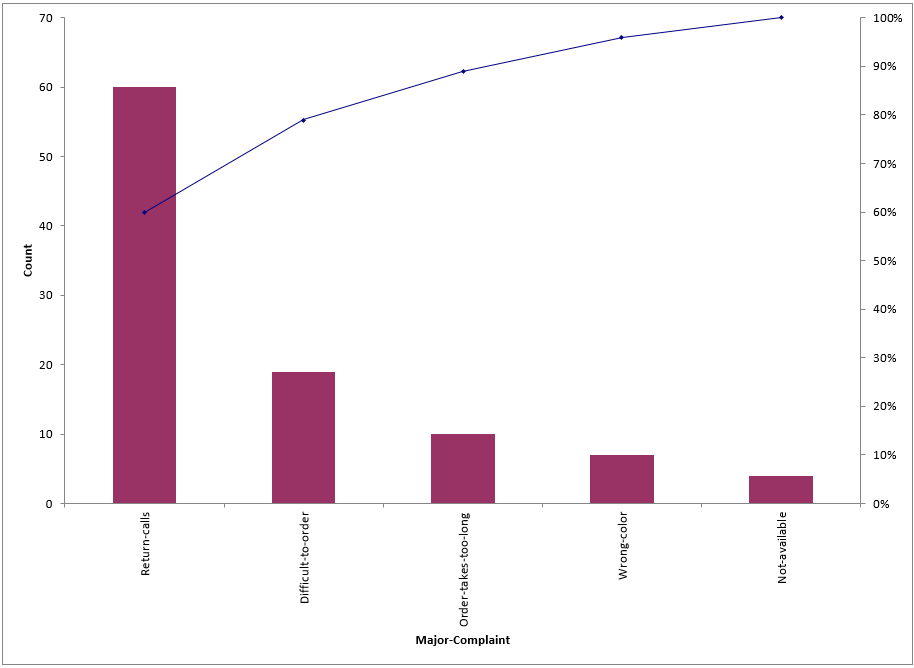
Click the Pareto Chart button to produce the Pareto Chart:
 .
.Notes:
- This Pareto Chart template should be used with count data like number of errors. You can also create Pareto charts with cost data.
- You can replace the Category and Count column headings with any headings that you wish.
- Enter the Pareto categories in the Category column. These can be Name, Location, Error Type or other text information. Pareto categories are required and will appear on the horizontal X-Axis of the Pareto Chart.
- Enter your count (or cost) data in the Count column.
- Click the Pareto Chart button to create a Pareto Chart.
Histogram Example
Click SigmaXL > Templates & Calculators > Basic Graphical Templates > Histogram. Enter data as shown: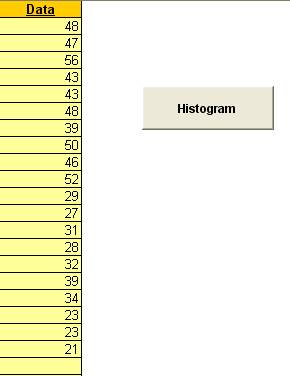
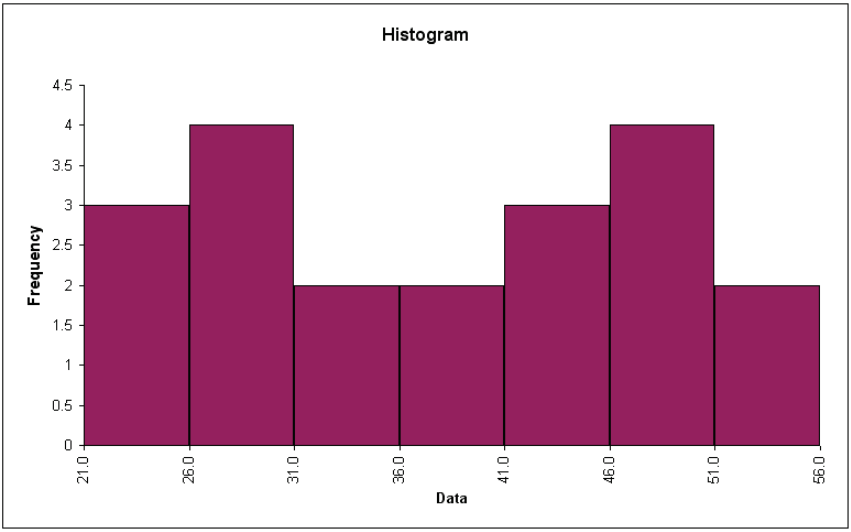
Click the Histogram button to produce the Histogram:
 .
.Notes:
- This Histogram template should be used with continuous data like cycle time.
- You can replace the Data column heading with any heading that you wish.
- Enter your data in the Data column.
- Click the Histogram button to create a Histogram.
Run Chart Example
Click SigmaXL > Templates & Calculators > Basic Graphical Templates > Run Chart. Enter the data as shown (copy and paste the histogram data):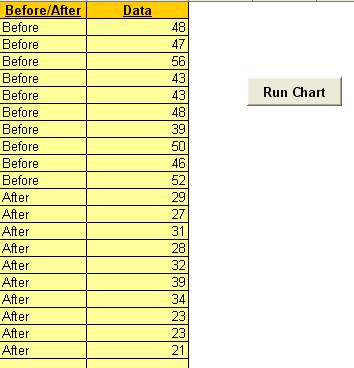
Click the Run Chart button to produce the Run Chart:
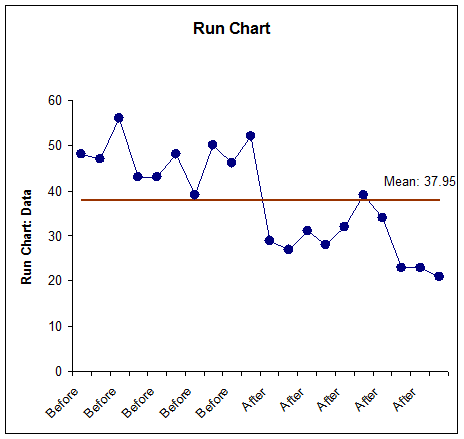 .
.Notes:
- This Run Chart template can be used with a variety of data types: continuous data like cycle time, count data like number of errors, or cost data. The data must be in chronological time-sequence order.
- You can replace the X-Axis Label and Data column headings with any headings that you wish.
- Enter your data in the Data column.
- Enter labels in X-Axis Label column. Labels can be Date, Time, Name, or other text information. These labels are optional and will appear on the horizontal X-Axis of the Run Chart.
- Click the Run Chart button to create a Run Chart.
Web Demos
Our CTO and Co-Founder, John Noguera, regularly hosts free Web Demos featuring SigmaXL and DiscoverSim
Click here to view some now!
Contact Us
Phone: 1.888.SigmaXL (744.6295)
Support: Support@SigmaXL.com
Sales: Sales@SigmaXL.com
Information: Information@SigmaXL.com


