Analyze General Full Factorial Designs
- Home /
- GFF Analyze

We will illustrate the use of a General Full Factorial to create a Randomized Complete Block Design (RCBD). The objective of the RCBD is to evaluate the efficacy of 3 different hypertension drug treatments on reducing systolic and diastolic blood pressure (BP), but we will only consider systolic in this example.
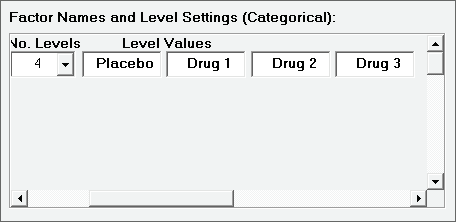
The treatment factor level values are: Placebo, Drug 1, Drug 2, Drug 3.
The block levels are age/sex combinations:
1 = Under 50/Female
2 = Under 50/Male
3 = Over 50/Female
4 = Over 50/Male.
The total number of runs will be 4 treatment levels * 4 block levels = 16.
The analysis of this General Full Factorial will be done using SigmaXL > Design of Experiments > Advanced Design of Experiments: General Full Factorial > Analyze General Full Factorial Design, but then General Linear Model (SigmaXL > Statistical Tools > General Linear Model > Fit General Linear Model) will be used to produce Confidence Intervals on Main Effects Plots and Pairwise Comparison of Means for Fixed Factors (with Tukey Test).
Note, the age/sex block factor in this experiment is a fixed factor but if we had something like Day or Batch as a block we could treat that as a Random factor in GLM to produce a Variance Components report.
Click SigmaXL > Design of Experiments > Advanced Design of Experiments: General Full Factorial > General Full Factorial Designs. Select Number of Categorical Factors = 1 and Number of Replicates = 4. Check Block on Replicates. In Design Power Information, check Include Blocks in Model. Enter Factor Name and Level Settings as shown. Scroll across to enter Level Values 3 and 4. Enter Response Name as Systolic BP.
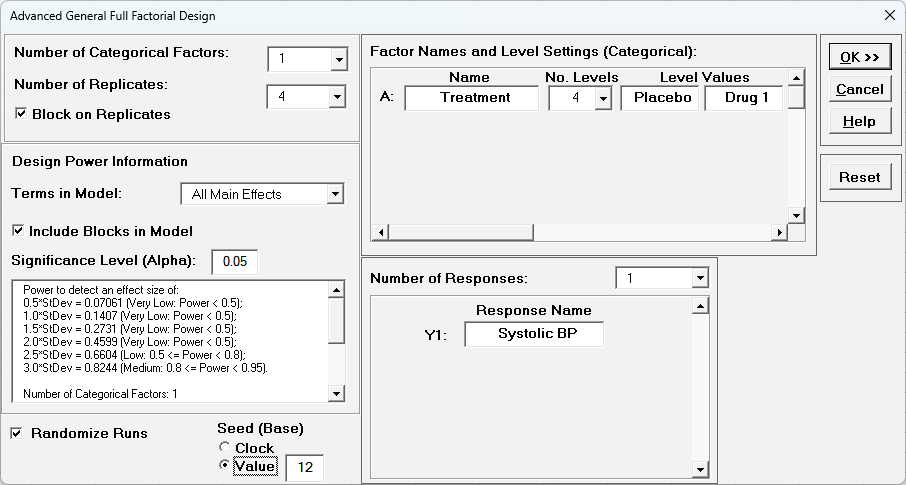
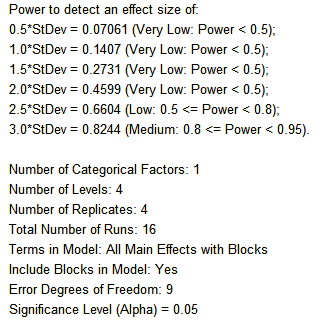
This design has medium power to detect an effect size = 3.0*StDev. with error degrees of freedom = 9 (scroll down to view). So, while this example is fine for illustrative purposes, it would be too underpowered for an actual clinical trial designed to determine treatment efficacy.
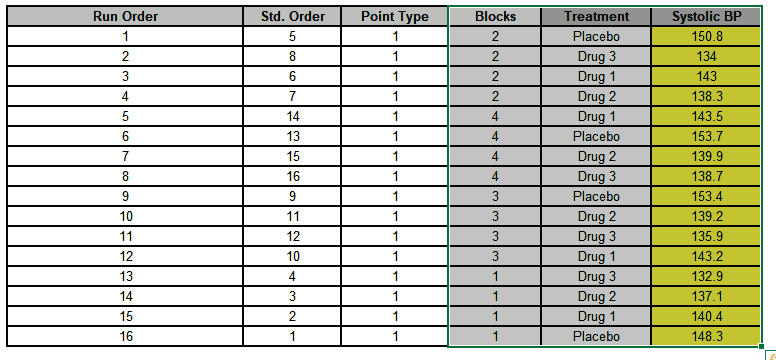
Click OK. The General Full Factorial Design Worksheet is given as:
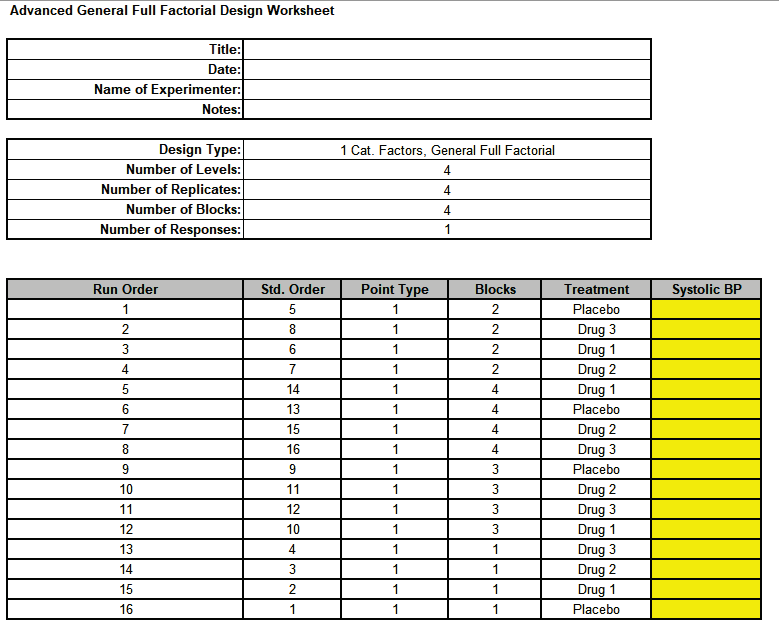
Open the file GFF RCBD Systolic BP.xlsx. This has the design worksheet populated with Systolic BP values.
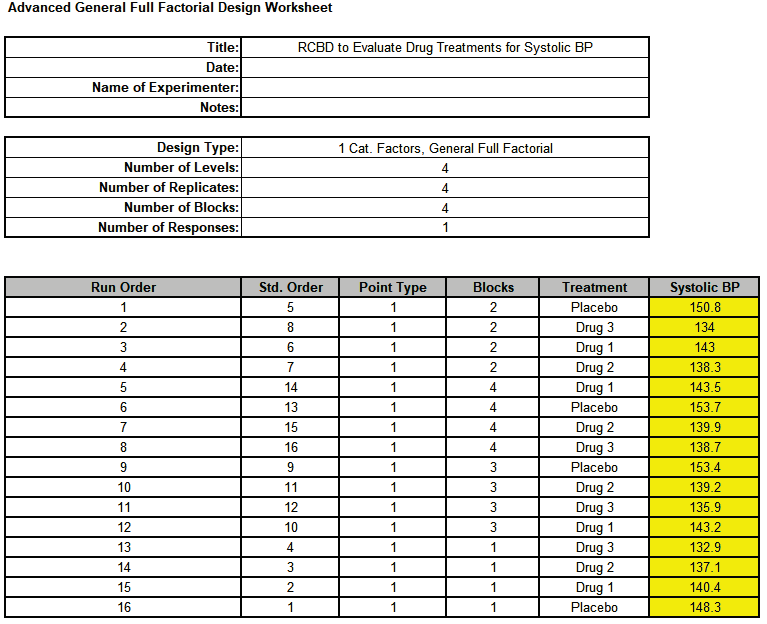
Note that the Blocks are randomized and the Treatment randomized with the Blocks.
Click SigmaXL > Design of Experiments > Advanced Design of Experiments: General Full Factorial > Analyze General Full Factorial Design.
Select Response and Model Term as shown with Term Generator as Main Effects. Click Model Terms >> to select Treatment. Check Include Blocks, Residual Plots and Main Effects Plots. We will not modify Advanced Options.
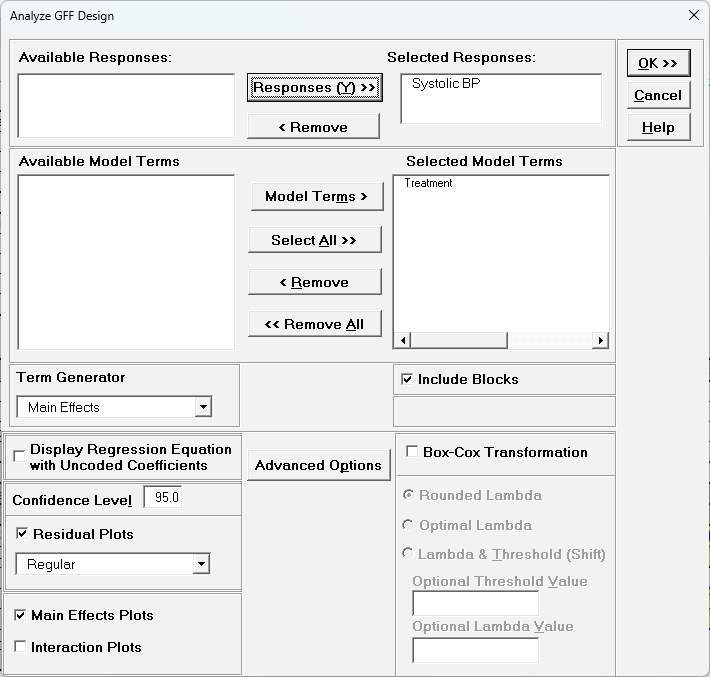
Click OK.

The R-Square, R-Square Adjusted and R-Square Predicted are all very good. Block 1 and Placebo are the hidden reference values in the Parameter Estimates table. Placebo is the reference value because it was specified as Level 1. Drug 2 and Drug 3 show a significant effect to reduce Systolic BP. We see in the ANOVA for Predictors table that the Blocks Term is significant, so blocking on Age and Sex was appropriate for this experiment to reduce the experimental error.
Click on Sheet GFF - Plots. The Main Effects Plots for Systolic BP are shown. These are calculated from the fitted means.
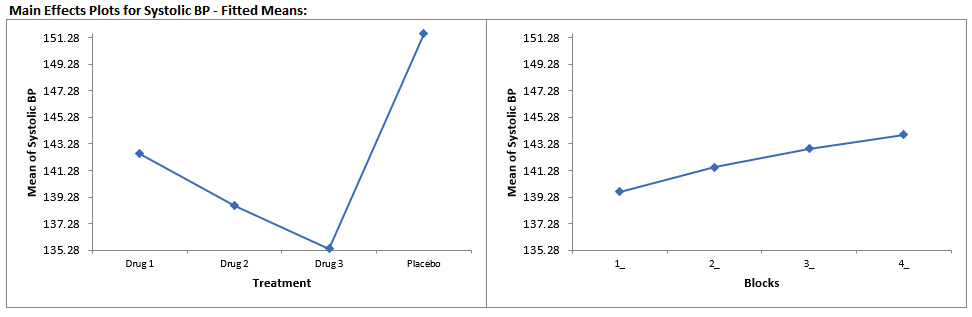
We can clearly see that Drug 3 has the lowest mean Systolic BP with Drug 2 as second lowest. We are not particularly interested in the Blocks other than the fact that they do contribute to the variability (and thereby reduce the experimental error in the model).
Click on the sheet GFF - Residuals.
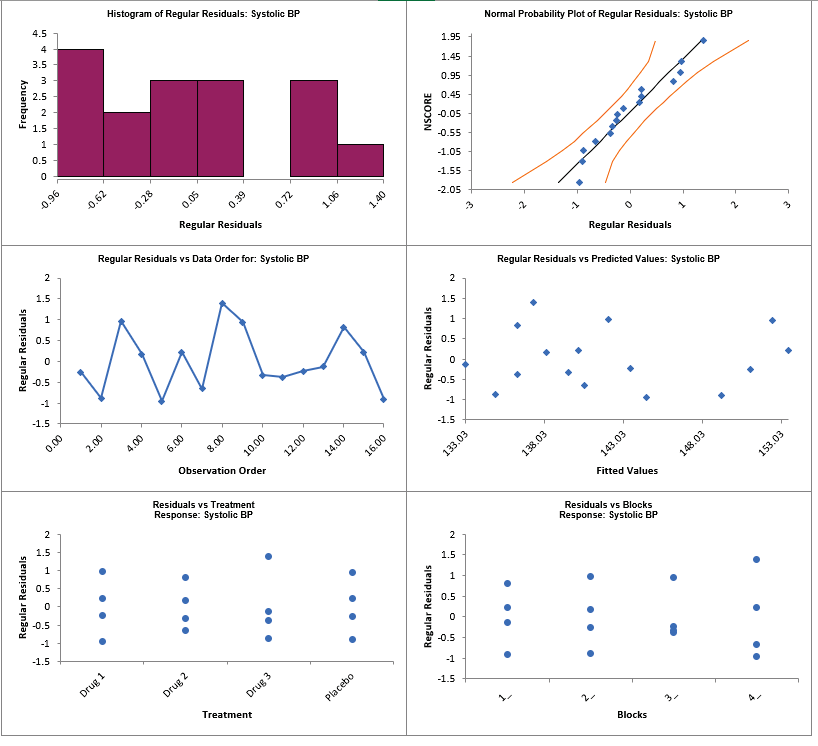
The residual plots look good, with no obvious non-normality or patterns.
Now we will re-analyze this experiment using General Linear Model. Click Sheet Systolic and select the data as shown:
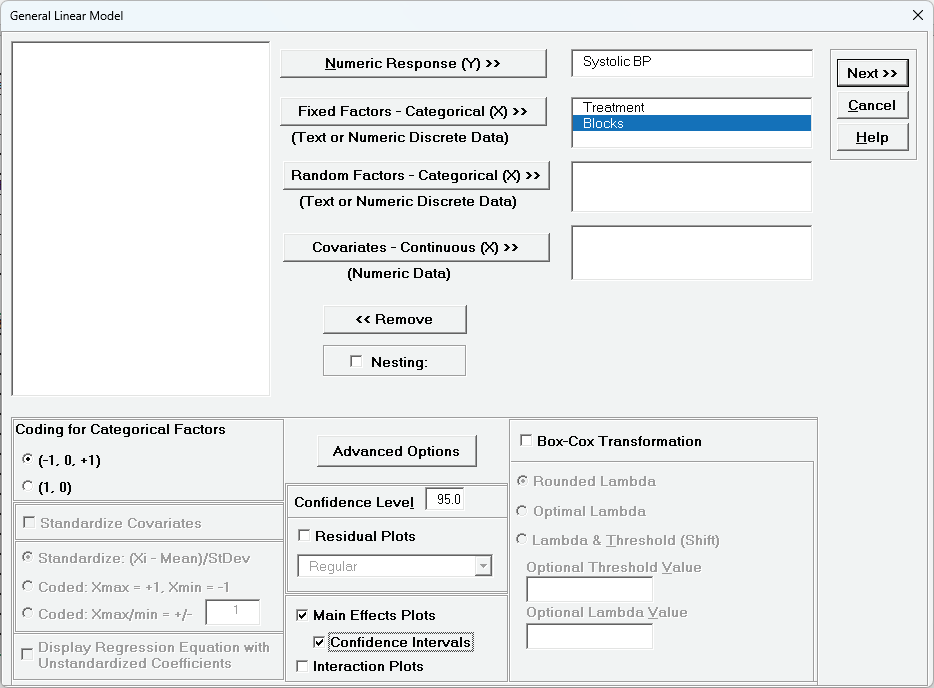
. Click SigmaXL > Statistical Tools > General Linear Model > Fit General Linear Model. Select the Response and Fixed Factors as shown. Uncheck Residual Plots. Check Main Effects Plots and Confidence Intervals. We will not modify Advanced Options.
Click Next >>. Select the Model Terms as shown.
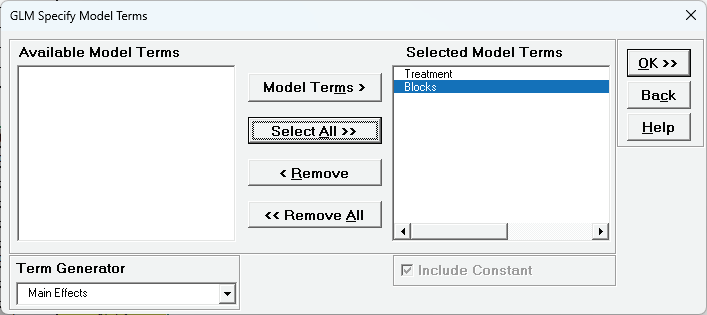
Click OK>>. The model report is the same as above except for the Block refence level.
Click on Sheet GLM - Plots. The Main Effects Plots with 95% Confidence Intervals are shown.
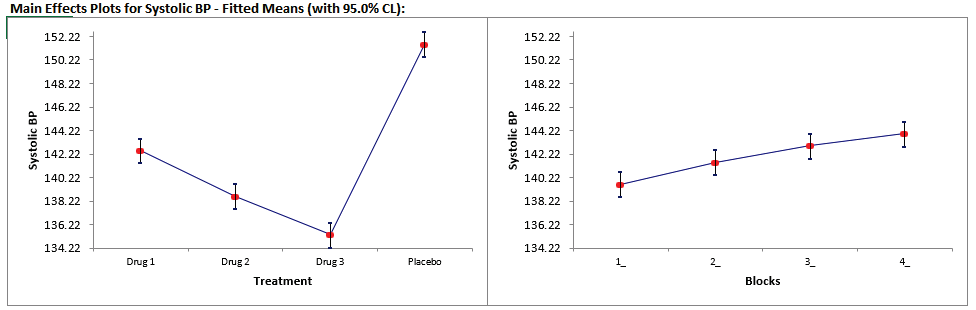
We can see that for Drug Treatment there is no overlap on the confidence intervals.
Click on Sheet GLM - Pair Comp.
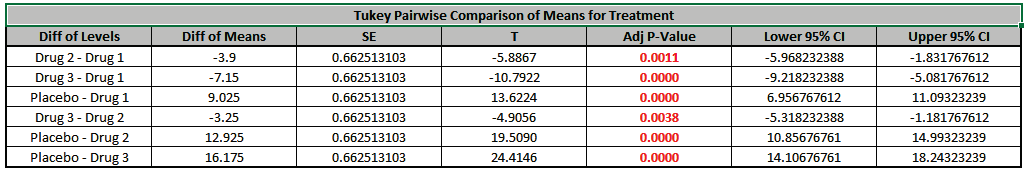
The Turkey Pairwise Comparison of Means for Treatment table clearly shows that all of the drugs are significantly better than the Placebo to reduce Systolic BP, but Drug 3 has the largest difference of 16.2 and is significantly better than Drug 1 and Drug 2.


