Moving Average (EWMA) Chart
- Home /
- EWMA


1. This Exponentially Weighted Moving Average (EWMA) Control
Chart template should be used with continuous data. The data must be
in chronological time-sequence order.
2. You can replace the X-Axis Label and
Data column headings with any headings that you wish. Enter
your data in the Data column.
3. Enter labels in X-Axis Label column. Labels can
be Date, Time, Name, or other text information. These labels are
optional and will appear on the horizontal X-Axis of the EWMA
Control Chart.
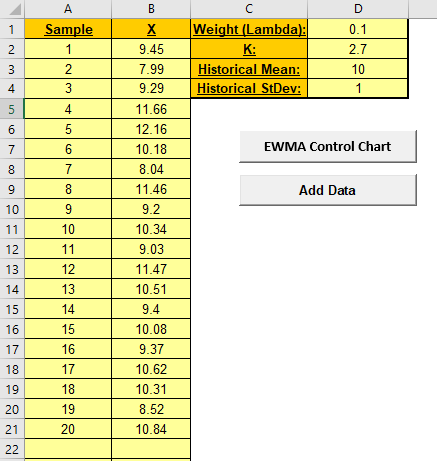
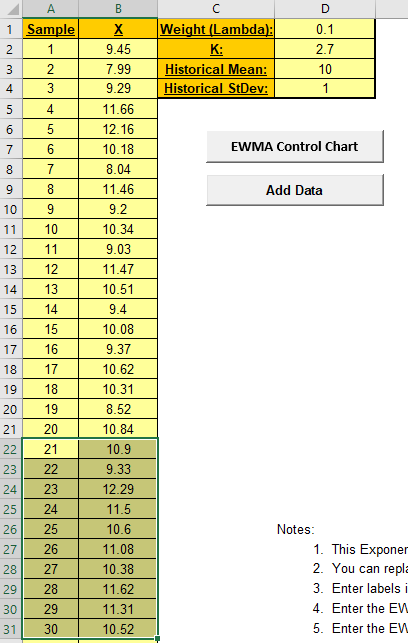
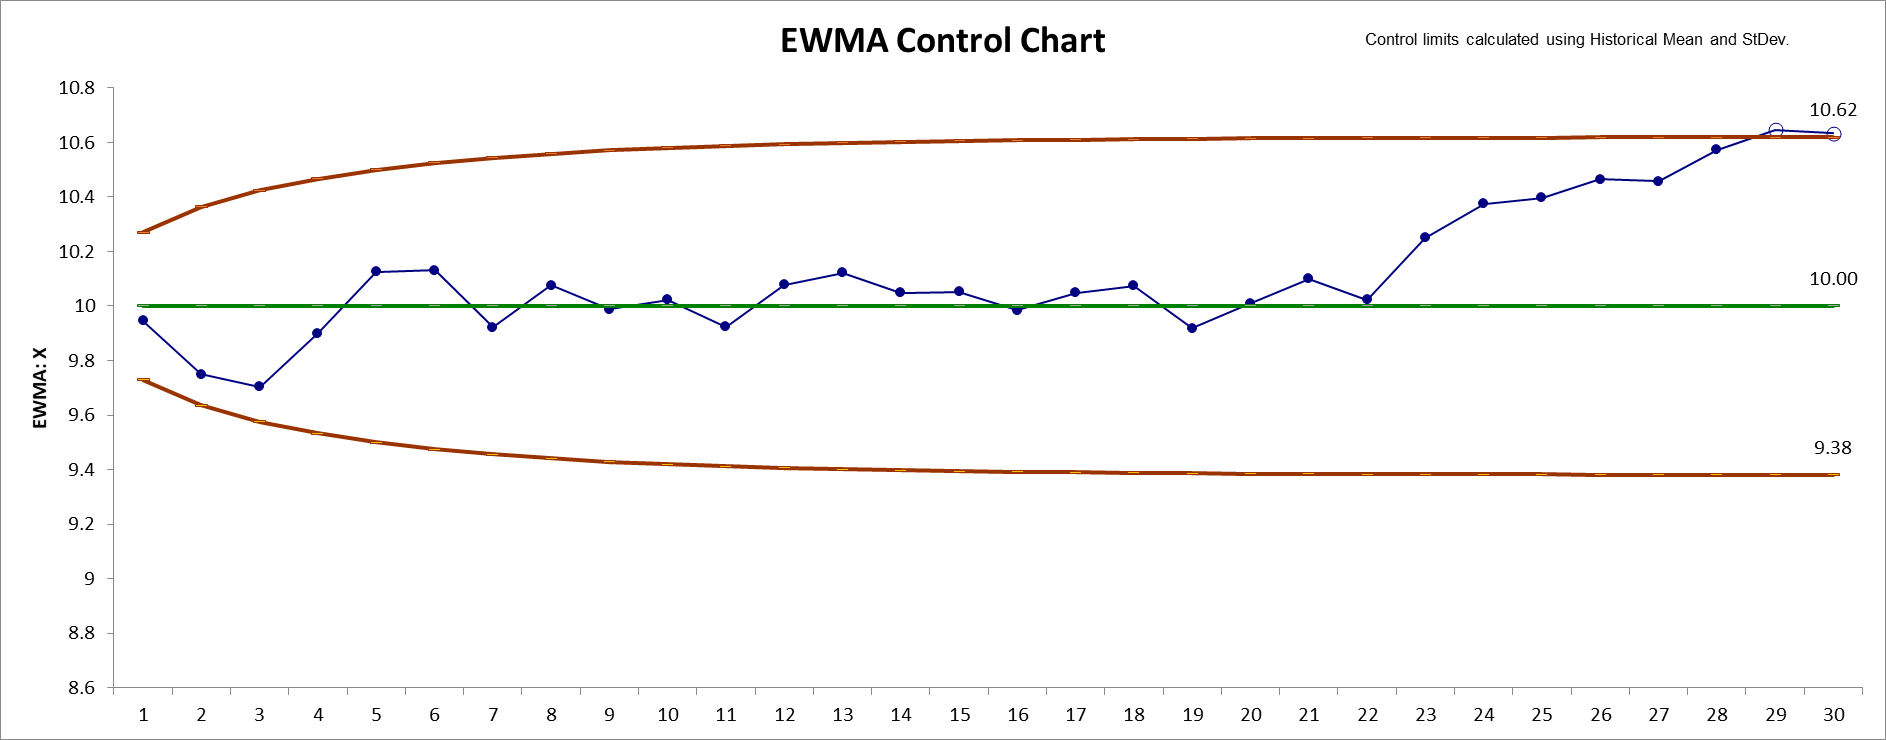
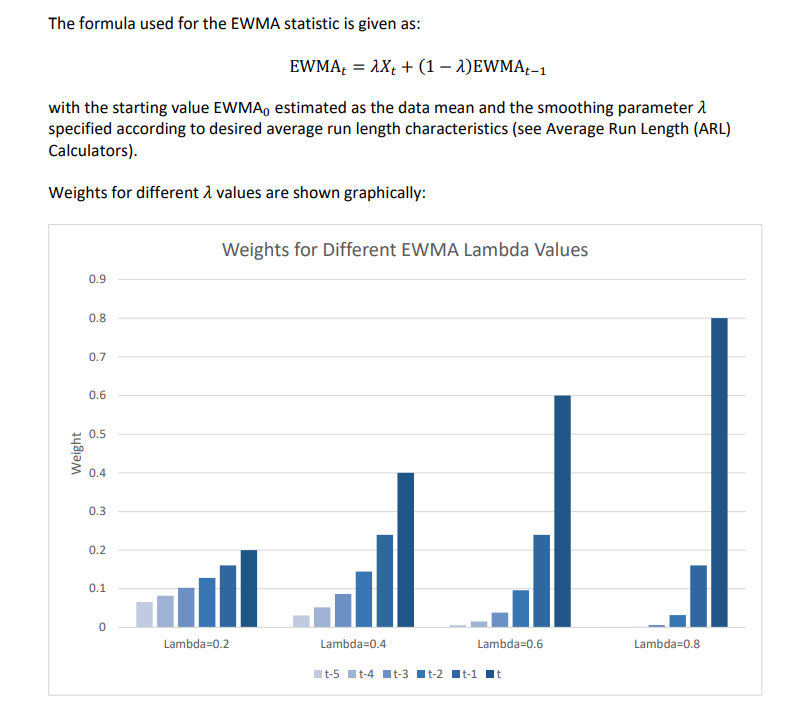
4. Enter the EWMA Weight (Lambda) in cell D1. This
is a value between 0 and 1 and controls the amount of influence that
previous observations have on the current EWMA statistic. A value
near 1 puts almost all weight on the current observation, making it
resemble a Shewhart chart. For values near 0, a small weight is
applied to almost all of the past observations, so the EWMA chart
performance is similar to that of a CUSUM chart.
5. Enter the EWMA K StDev multiplier in cell D2.
This is a value between 2 and 4. This is also referred to as L, but
SigmaXL uses K to avoid confusion with Lambda.
6. Weight (Lambda) and K values
affect the Average Run Length (ARL) characteristics. To determine
optimal EWMA parameter values and calculate ARL, click
SigmaXL > Templates and Calculators > Control Chart Templates >
Average Run Length (ARL) Calculators > EWMA ARL.
7. Historical Mean (D3) and Historical
StDev (D4) are optional. Enter values if process mean and
standard deviation are known.
8. Click the EWMA Control Chart button to create an
EWMA Control Chart.
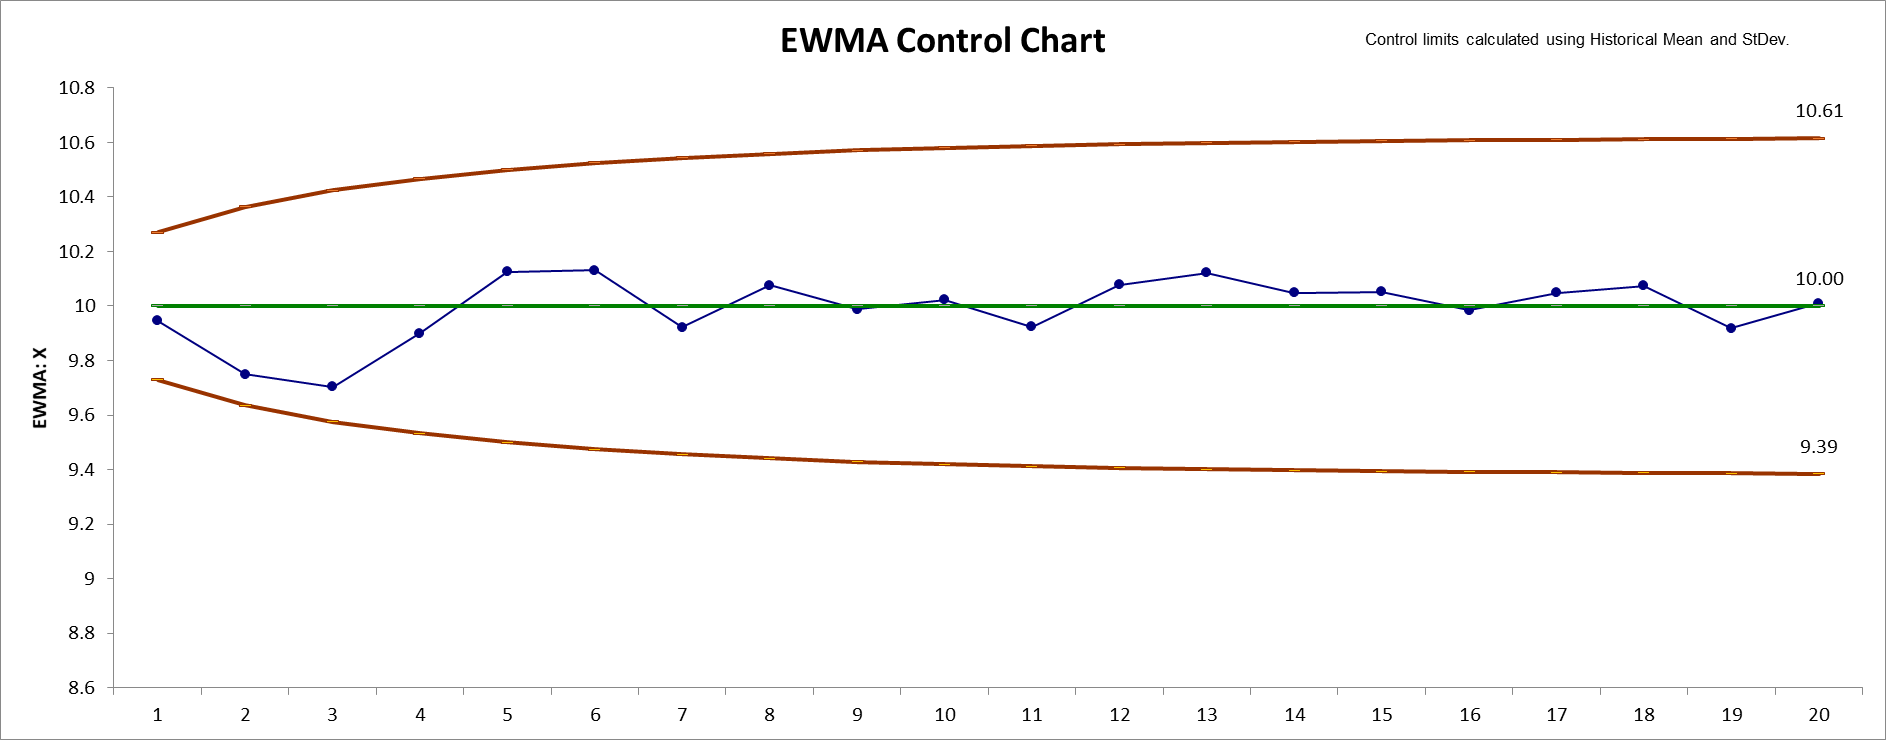
9. After the control chart has been created and additional new data
entered into the Data column, click the Add
Data button to add the data to the existing chart. Control
limits will be calculated using the original chart mean and stdev or
specified Historical Mean/StDev.
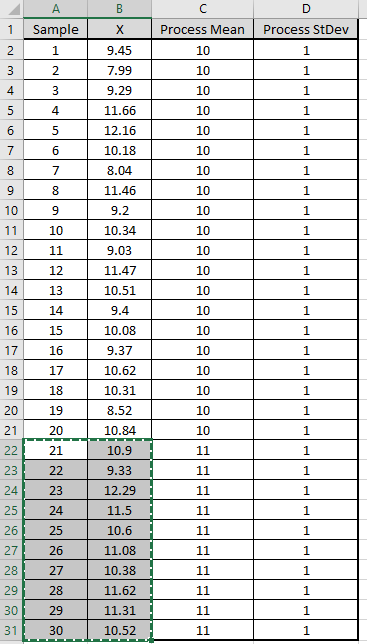
10. Add Data should only be used if there are at
least 20 observations in the original chart, or Historical Mean and
StDev have been specified.
11. Weight (Lambda) and K parameters
are dynamic. If they are modified, the chart will automatically
update with the new parameters. However, they should be selected
prior to creating the EWMA chart. Data values and out-of-control
formatting are refreshed only when the buttons are used.
12. Reference: Montgomery, D.C. (2013), Introduction to
Statistical Quality Control, Seventh Ed., Wiley, pp. 433-438.


