Data Manipulation in Excel Using SigmaXL
This help guide covers the SigmaXL Data Manipulation tools available in the SigmaXL Excel add-in, including subsetting data by category, random selection, numerical value, and date range.
Introduction to Basic Data Manipulation
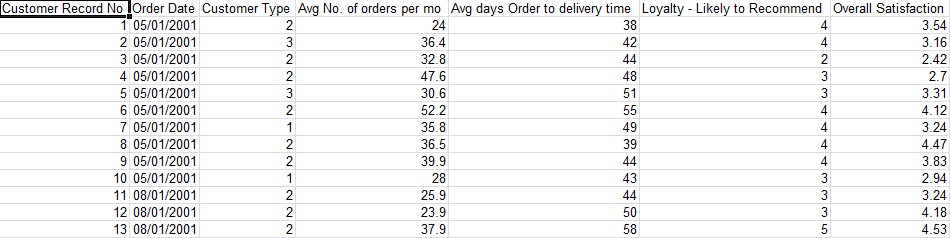
Open Customer Data.xlsx (to access, click SigmaXL > Help > Sample Data or Start > Programs > SigmaXL > Sample Data ). This data is in stacked column format. This format is highly recommended for use with SigmaXL. Note that all pertinent information is provided in each record (row). Also note that only one row is used for column headings (labels) and there are no blank rows or columns. Each column contains a consistent format of either numeric, text, or date. This is also the data format used by other major statistical software packages.
Note that Loyalty, Overall Satisfaction, Responsive to Calls, Ease of Communications, and Staff Knowledge were obtained from surveys. A Likert scale of 1 to 5 was used, with 1 being very dissatisfied, and 5 very satisfied. Survey results were averaged to obtain non-integer results.
Category Subset
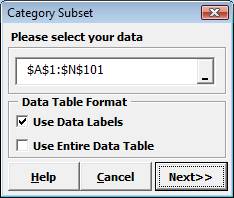
- Click SigmaXL > Data Manipulation > Category Subset.
- If you are working with a portion of a dataset, specify the appropriate range, otherwise check Use Entire Data Table.
- Click Next.
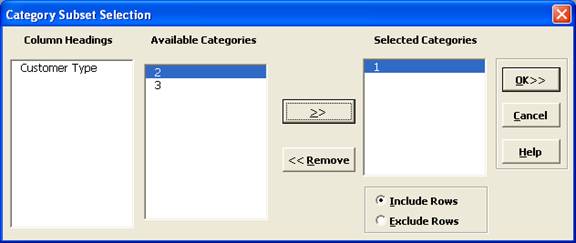
- Select Customer Type, 1, >> as shown:
- Click OK.
A new subset worksheet is created containing only Customer Type 1.
Note: We could have chosen more than one Customer Type and had the option to create a subset which included or excluded these Customer Types.
Random Subset
- Click Sheet 1 Tab of Customer Data.xlsx.
- Click SigmaXL > Data Manipulation > Random Subset.
- Ensure that the entire data table is selected. If not, check Use Entire Data Table. ClickNext.
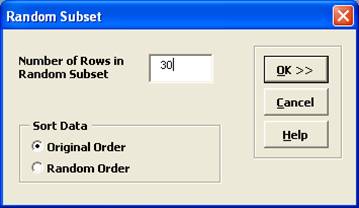
- Enter Number of Rows in Random Subset as 30. The default Sort Data selection is Original Order.
- Click OK. A new worksheet is created that contains a random subset of 30 rows. This feature is useful for data collection to ensure a random sample, e.g., given a list of transaction numbers select a random sample of 30 transactions.
Numerical Subset
- Click Sheet 1 Tab of Customer Data.xlsx.
- Click SigmaXL > Data Manipulation > Numerical Subset.
- Ensure that entire data table is selected. If not, check Use Entire Data Table. Click Next.
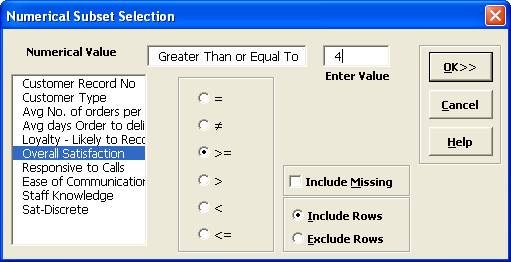
- Select Overall Satisfaction, >=, Enter Value as 4.
- Click OK.
A new subset worksheet is created containing only those rows with Overall Satisfaction >= 4.
Date Subset
- Click Sheet 1 Tab of Customer Data.xlsx.
- Click SigmaXL > Data Manipulation > Date Subset.
- Ensure that entire data table is selected. If not, check Use Entire Data Table. Click Next.
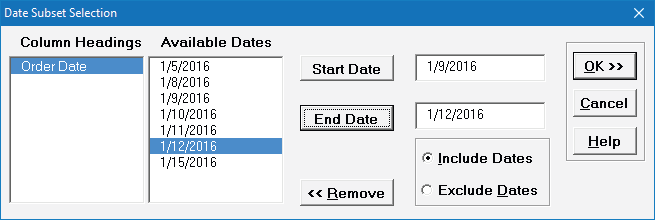
- Select Order Date, select 1/9/2016, click Start Date, select 1/12/2016, click End Date.
- Click OK. A new subset worksheet is created containing only those rows with Order Date between 1/9/2016 to 1/12/2016.