- LIVE HELP IS

Input Distribution Correlations
Copulas are functions that describe dependencies among variables, and provide a way to create distributions to model correlated multivariate data. Using a copula, a data analyst can construct a multivariate distribution by specifying marginal univariate distributions, and choosing a particular copula to provide a correlation structure between variables. There are a number of different families of copulas; in this context we use a Gaussian copula.
To take the simplest example, we would first generate pairs of values from a bivariate normal distribution - this is easily done by multiplying two independent normal draws using the Cholesky matrix. The copula is then generated simply by taking the CDF of each of the vectors of the bivariate draw, so that each is uniformly distributed U(0,1). Finally, applying the inverse CDF of any distribution, e.g., F, to a U(0,1) random variable results in a random variate whose distribution is exactly F, with the specified correlation structure. This is known as the Inverse method. For further details, see http://en.wikipedia.org/wiki/Copula_(statistics).
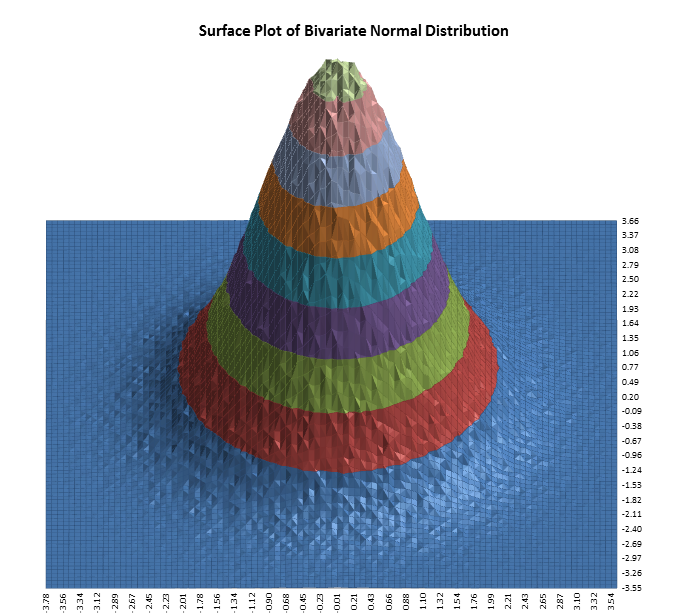
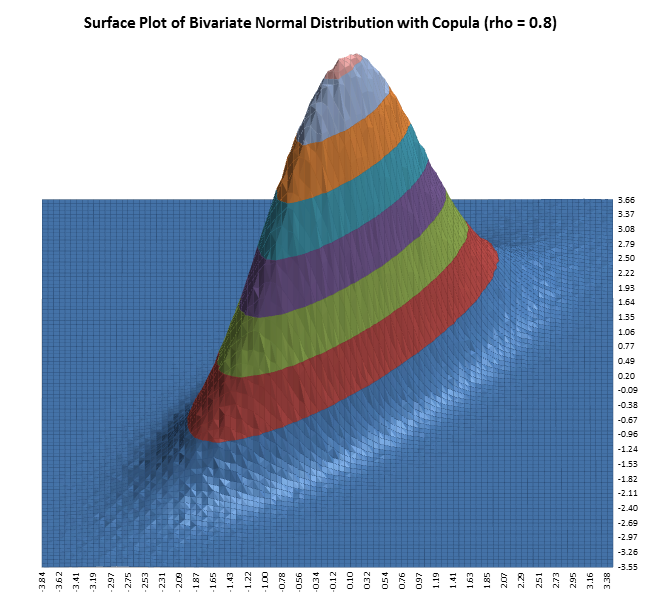
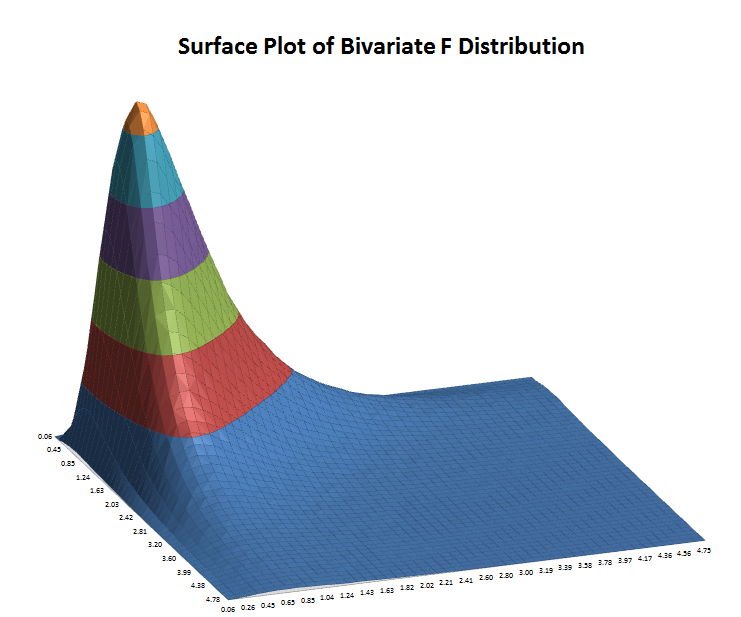
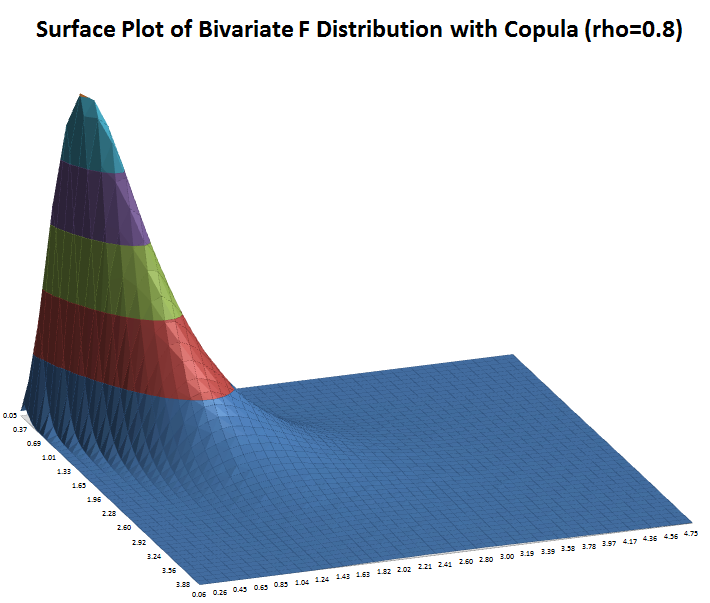
The following surface plots illustrate how a correlation copula changes the shape of a bivariate distribution (these plots were created using Excel’s 3D Surface Plot) :
 |
 |
 |
 |
Define, Measure, Analyze, Improve, Control


Simulate, Optimize,
Realize

Web Demos
Our CTO and Co-Founder, John Noguera, regularly hosts free Web Demos featuring SigmaXL and DiscoverSim
Click here to view some now!
Contact Us
Phone: 1.888.SigmaXL (744.6295)
Support: Support@SigmaXL.com
Sales: Sales@SigmaXL.com
Information: Information@SigmaXL.com
 Facebook
 LinkedIn
 YouTube
Copyright © 2002 - SigmaXL | Privacy Policy & Legal Notices | Terms & Conditions